
Grid view
The Grid view displays data in an infinitely-scrollable, spreadsheet-like interface in the results pane of the Trillion-Row Spreadsheet.
By default, data in the Trillion-Row Spreadsheet (TRS) is displayed in the Grid view. The Grid view is an infinitely-scrollable, spreadsheet-like view of a table or worksheet.
In addition to viewing table or query data, you can interact with the data directly from within the grid. For example, you can use the grid to hide and rearrange columns, sort rows, perform a row selection, and analyze column data.
The Grid view in the results pane is accessed by clicking the Grid
View (![]() ) icon in the View bar.
) icon in the View bar.
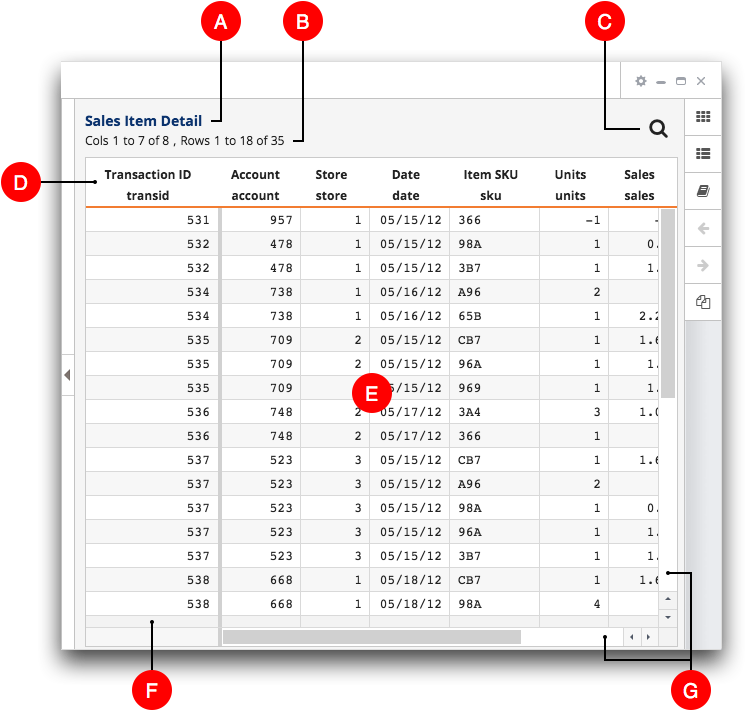
- A. Table title
- The table title, also referred to as the table label, identifies the table or worksheet. The table title is different from the table name.
- B. Column and row counts
- The column and row counts show the total number of column and rows in the table or
worksheet. It also indicates which columns and rows are currently displayed.
The number of columns and rows shown is dependent on the size of the TRS window. You can resize the window to change the number of visible rows and columns.
If the entire table cannot be displayed in the window, the TRS displays scroll bars on the side or bottom of the grid.
- C. Find rows
- This icon opens the Find rows dialog where you can locate rows in the table or worksheet by entering any valid selection expression. For instructions, see Find rows using a selection expression.
- D. Column header row
- The column header row in the grid displays the column header which contains the
column name, column, label, or both. You can choose which is displayed by adjusting
your user profile settings. For instructions, see Change your user settings.
When you place the pointer over a column header, the TRS displays additional information about the column. For details, see Column information. In addition, a drop-down arrow (
 )
icon and a blue column header handle appear.
)
icon and a blue column header handle appear.Use the options in the drop-down menu to sort, hide, resize, or modify a column. For a description of each option, see Column header menu options. Drag the blue handle to resize a column. For more information, see Resize a column within the grid.
Finally, you can drag a column header to rearrange columns in the table or worksheet. For instructions, see Rearrange columns using the grid.
- E. Grid
- The grid displays data from the table or worksheet in an infinitely-scrollable,
spreadsheet-like interface.
You can right-click a cell in the grid to access a menu of options available to perform on the data. For example, you can copy the contents of a cell, perform a row selection based on the cell data, and analyze the column data.
- F. Fixed columns
- Fixed columns, when they exist in a table or worksheet, are always visible and are separated from the other columns by a thicker vertical line. Fixed columns do not move, regardless of how far the table is scrolled in either direction. This is useful when a column has key information that should always be shown.
- G. Scroll bars
- Scroll bars appear on the side or bottom of the grid when the entire table or
worksheet cannot be displayed in the TRS window. Use the scroll
bars to navigate through the rows and columns in the grid.
You can also go directly to a specific row or column by right-clicking the appropriate scroll bar and specifying the location in the dialog. For instructions, see Scroll directly to a specific row and Scroll directly to a specific column.