
Column information
Column information is provided throughout the web interface in the 1010data Insights Platform.
There are several locations in the web interface where you can view information about a column in a table. This topic lists the most common ways you can view column information.
To learn about the different column data types available in the Insights Platform, see Data types.
Grid View
The Grid view is available from the results pane in both the Trillion-Row Spreadsheet and Macro Language Workshop. When viewing a table in the Grid view, place the pointer over a column header to view information about the column.
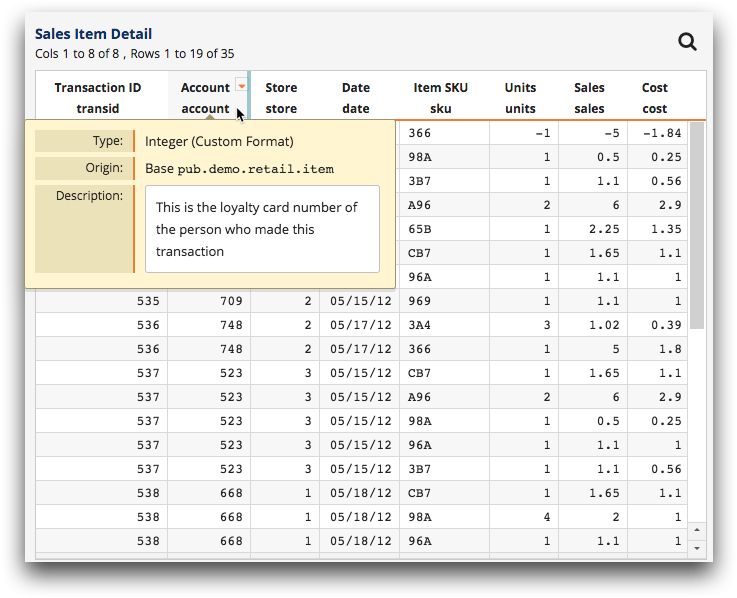
- Column name
- The name of the column. The column name is the name used to refer to a column in Macro Language code. The column name is displayed only if it is not shown in the column header.
- Column label
- The label of the column. The column label is an optional descriptive column title. The column label is displayed only if it is not shown in the column header.
- Type
- The kind of data contained in the column and its display format. For more information, see Data types and display formats.
- Origin
- Information about the source of the column. The origin information
varies and is based on whether the column is local, linked, computed, or
tabulated.
- Local
- If the column is physical column, the path to the base table containing the column is listed.
- Linked
- If the column is a linked column, the path of the foreign table containing the column is listed.
- Computed
- If the column is a result of a computed column, a definition of the computation is listed.
- Tabulated
- If the column is a result of a tabulation column break, an
indication of whether the column is a row or column break is
listed.
If the result of the tabulation is a
<tcol>column, an indication of whether the column is a table, row, or cell aggregation is listed.
- Description
- An explanation of the column values and their meaning.
For more information about the Grid view, see Grid view.
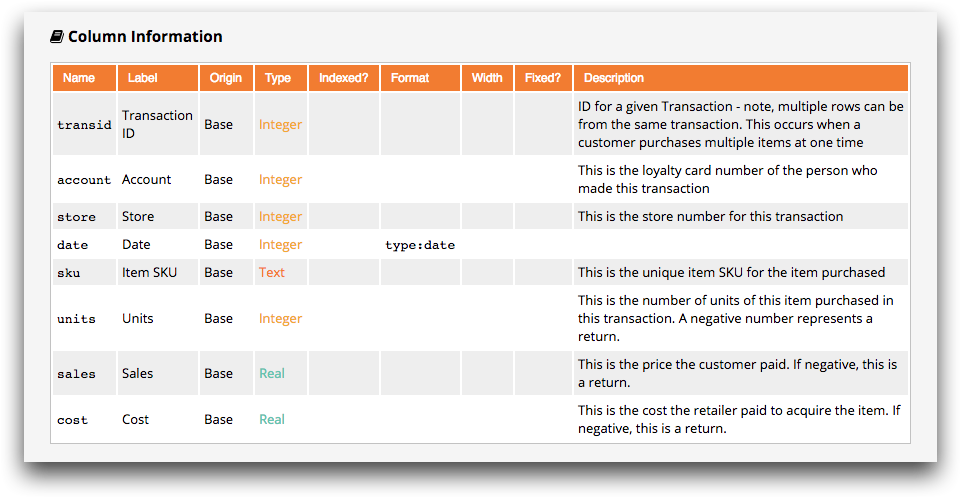
Data Dictionary
The data dictionary is available from the results pane in both the Trillion-Row Spreadsheet and Macro Language Workshop. For more information about the Data Dictionary, see Data Dictionary.
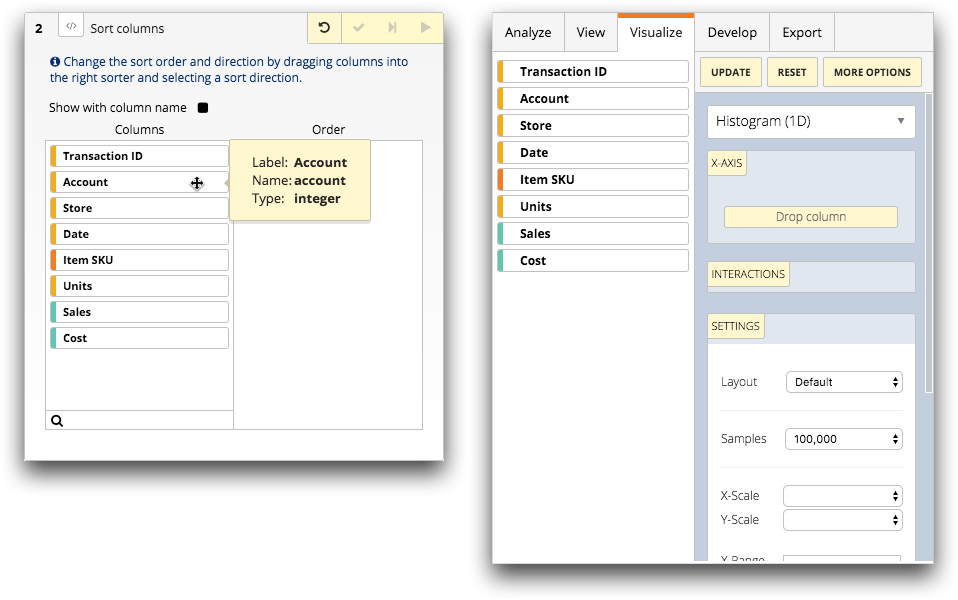
Column biscuits
In certain panels in the Analysis Timeline, and within the data columns panel of the Chart Builder, columns are displayed as biscuits. Each column biscuit is color coded so that you can quickly determine its data type. In addition, you can also place the pointer over a biscuit in the timeline to view column information. For more information about the timeline, see Analysis Timeline. For more information about the Chart Builder, see Chart builder.
| Color | Data Type |
|---|---|
| Yellow | integer |
| Purple | big integer (Available as of version 11.25) |
| Teal | decimal |
| Orange | text |