
Chart builder
The chart builder in the Visualize tab allows you to create new charts or modify the appearance of existing charts using a drag-and-drop interface and customizable settings.
The chart builder appears in the Visualize tab of the TRS window. It consists of multiple sections in the analysis pane that allow you to configure the type of chart, the columns of data to be plotted, and a number of customizable settings such as the size of the chart, its background color, title, theme, axes, ticks, and legend. Any changes with respect to these settings are reflected immediately in the chart. The chart is displayed in the results pane on the right.
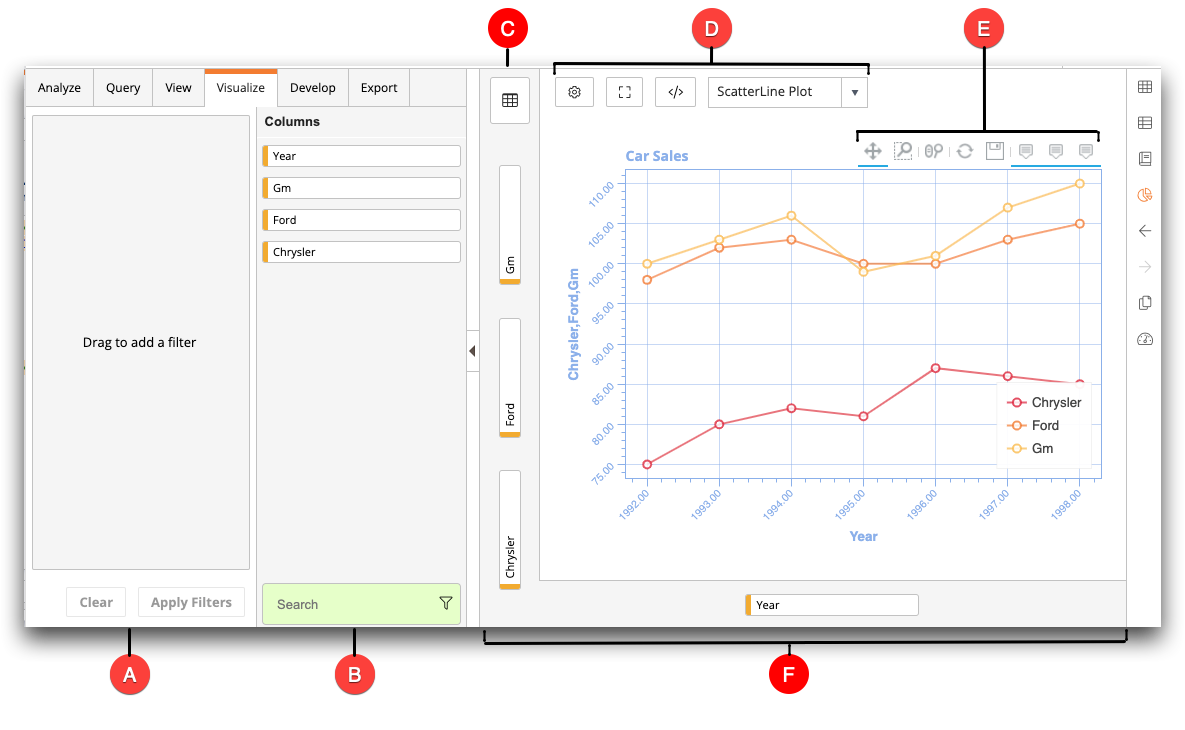
- A. Column filters
- Drag and drop columns here to filter one or more columns for the chart. Click Apply Filters when finished.
- B. Columns
- Lists all of the columns from the current table or worksheet that are available for plotting in a chart. If you have many columns, you can use the search feature.
- C. Tabulations (
 )
) - You can select a quick tabulation option from the drop-down list. Options include counts, unique count, average, standard deviation, and sum.
- D. General settings
- General settings contains the following:
- More options (
 )
) - Sets options for the chart, such as title, X-axis and Y-axis labels, legends, tooltips, and grid lines.
- Show/Hide axes (
 )
) - Click to toggle the X-axis and Y-axis labels on and off.
- Show visualization/Show code (
 )
) - Click to toggle between showing the chart and showing the underlying Macro Language code.
- Chart type
- Select a chart type from the drop-down list.
- More options (
- E. Bokeh chart interaction tools
- All 1010data charts have bokeh chart interaction options. Depending on the type of
chart, certain interactions are not applicable.
- Pan (
 )
) - Allows you to pan the plot by clicking and dragging the mouse across the plot region.
- Box zoom (
 )
) - Allows you to define a rectangular region in which to zoom the plot. Click and drag the mouse to create the rectangular region.
- Wheel zoom (
 )
) - Allows you to zoom the plot in and out, centering on the current mouse location. Use the mouse scroll wheel or a trackpad to zoom in and out.
- Reset (
 )
) - Restores the plot ranges to their original values after moving on zooming in on the plot.
- Save (
 )
) - Allows you to save a PNG image of the chart.
- Hover (
 )
) - Allows you to hover over the plot to view plot details.
- Pan (
- F. Chart
- The chart is displayed in the results pane of the TRS window.