
Create a chart
Create a chart for the current table or worksheet by selecting a chart type and then specifying the data columns to be plotted.
It can sometimes be easier to find trends and see differences more easily in a chart.
For example, it may be quicker and easier to find the day of sales with the highest
profit margin from a chart than from a table of numbers listing the same
information. Charting can help you make sense of large amounts of data that might
otherwise be too overwhelming to comprehend.
Note: A chart is not retained when you
save your analysis as a Quick Query or export it as a QuickApp. To save the
chart with your query, save your analysis as a workspace. For instructions, see
Save your workspace.
To create a chart:
-
In an open table or worksheet in TRS, click the
Visualize tab.
The 1010data Insights Platform displays a columns and a filters panel in the analysis pane, and an empty chart in the results pane.
-
In the chart type drop-down list in the results pane, select a chart
type.
For information about the available chart types, see Chart types.
-
Optional: Drag columns to the filter panel to filter (select) the data. After
you filter the data, click Apply Filters.
Note: The filter panel performs only simple range select statements. For more complex filters, you would need to return to the Analysis Timeline (Analyze tab), perform the search, and return to the chart builder.
-
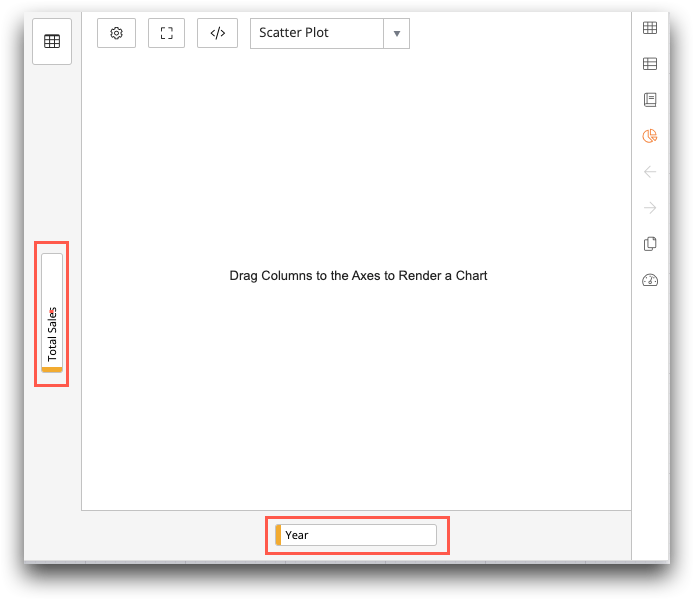
For each column that you want to plot, drag it from the columns panel into the
area in the chart builder associated with the axis where you want that data
plotted.
For example, if you want to plot car sales by year, you would drag the Year column to the X-axis and the Total Sales column to the Y-axis.
 The chart builder creates the chart automatically in the results pane of the TRS window.
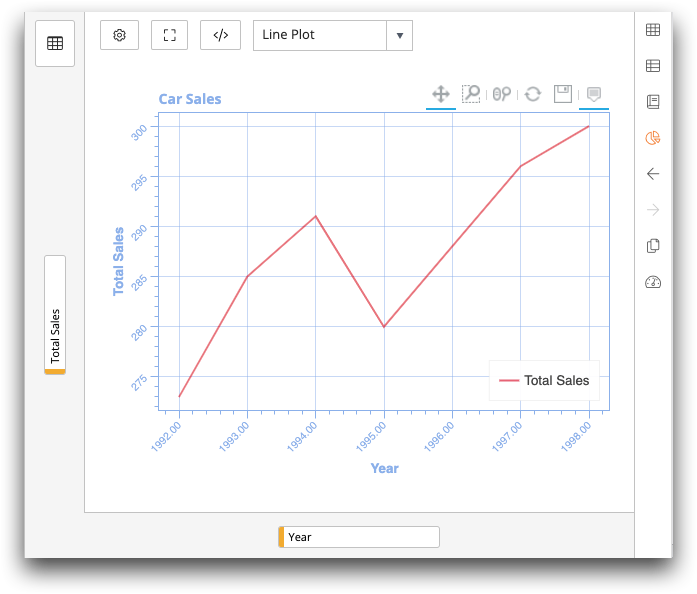
-
Optional: Click More Options (
 ) to make any
desired changes to the display, such as adding a chart title, X-axis and Y-axis
labels, and turning on/off tooltips.
For more information, see More Options.
) to make any
desired changes to the display, such as adding a chart title, X-axis and Y-axis
labels, and turning on/off tooltips.
For more information, see More Options. -
Optional: Click the desired interaction tool to pan the chart or zoom in to
view data points.
Click Reset to return to the default view of the chart.