
More Options
More Options ( ) allows
you to create chart labels, axis labels, and customize other elements of the chart.
) allows
you to create chart labels, axis labels, and customize other elements of the chart.
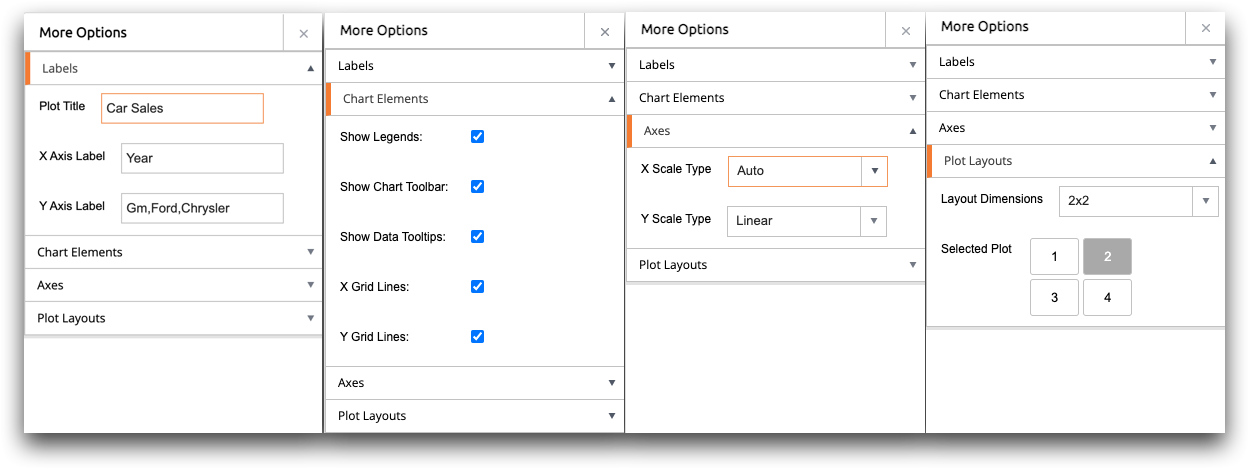
More Options consists of the following:
- Labels
-
- Plot Title
- The title of the chart.
- X Axis Label
- The label for the X-axis, such as Year in a chart that shows yearly sales.
- Y Axis Label
- The label for the Y-axis, such as Sales in a chart that shows yearly sales.
- Chart Elements
-
- Show Legends
- Select to show the chart legend in the lower right corner of the chart.
- Show Chart Toolbar
- Select to show the chart toolbar, such as the zoom in tools and the save tool.
- Show Data Tooltips
- Select to show details when you hover over the data point.
- X Grid Lines
- Select to show vertical grid lines along the X-axis (if applicable).
- Y Grid Lines
- Select to show horizontal grid lines along the Y-axis (if applicable).
- Axes
-
- X Scale Type
- Use a linear or log scale for the X-axis (if applicable).
- Y Scale Type
- Use a linear or log scale for the Y-axis (if applicable).
- Plot Layouts
-
- Layout Dimensions
- From the drop-down list, select whether you want a 1x1 grid (the default value), a 1x2 grid, or a 2x2 grid. You can then customize each grid in the results pane.
- Selected Plot
- If using a 1x2 or 2x2 grid, select the plot to apply changes to each plot. If you are using the default 1x1 grid, grid 1 is automatically selected.