Chart types
Numerous chart types are supported in the 1010data Insights Platform, including line, scatter, pie, bar, and histogram charts.
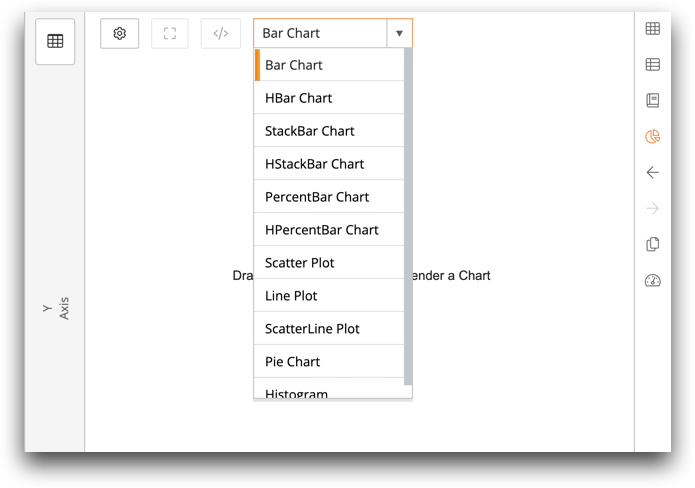
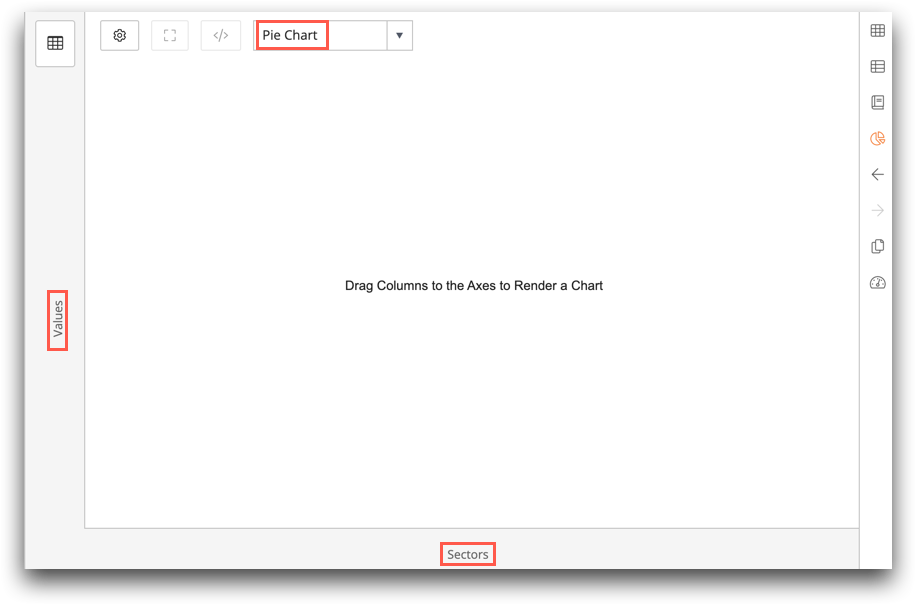
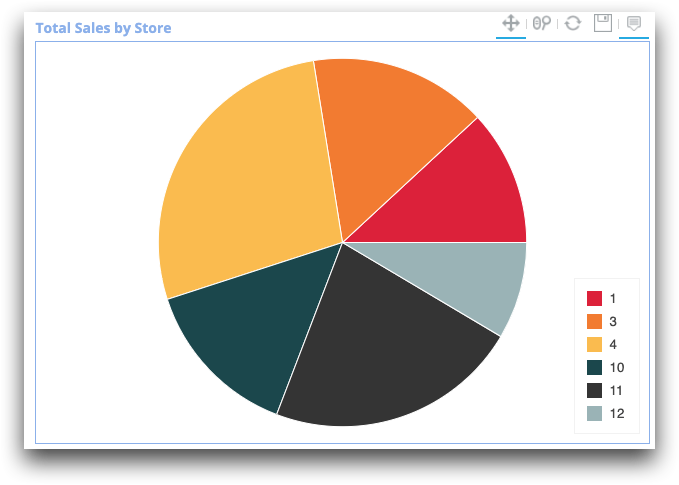
The chart type drop-down list allows you to choose the type of chart you want to create. The options available in the chart change depending on the chart type. For example, if you select Bar Chart, you will have the option of selecting a Category Axis and a Y Axis. If you select Pie Chart (shown below), you will have the option of selecting Sectors and Values.
Information about each of the different chart types available in the chart builder is provided below.
class_="bokehchart" in the 1010data
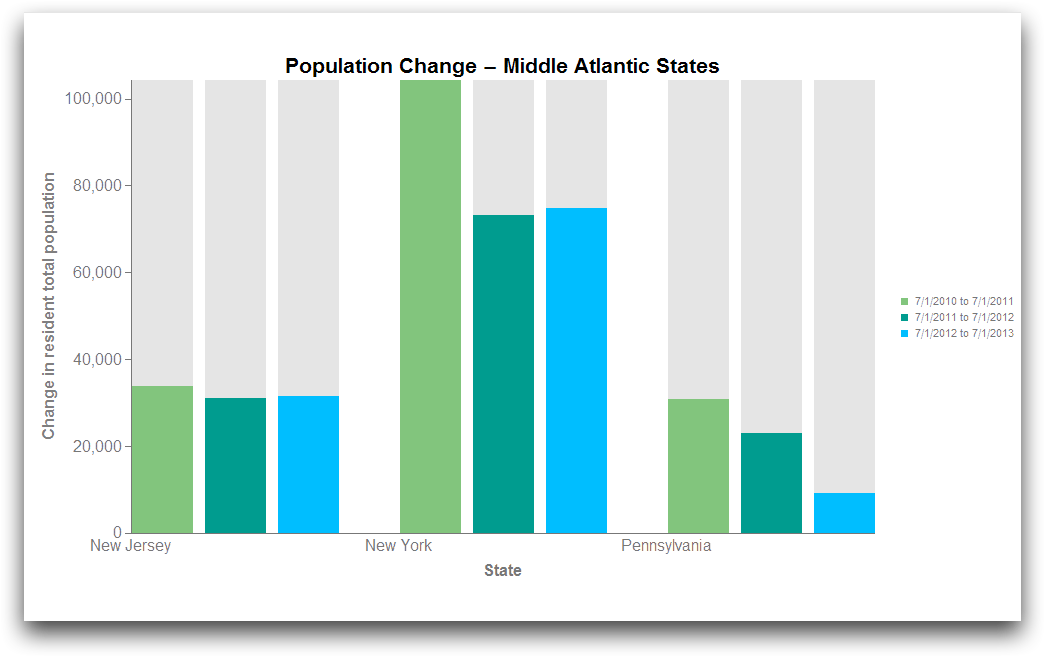
Reference Manual for instructions on creating charts in the Macro Language.Bar Chart/HBar Chart
A chart with either vertical or horizontal bars that proportionally represent the values of various subsets of data.
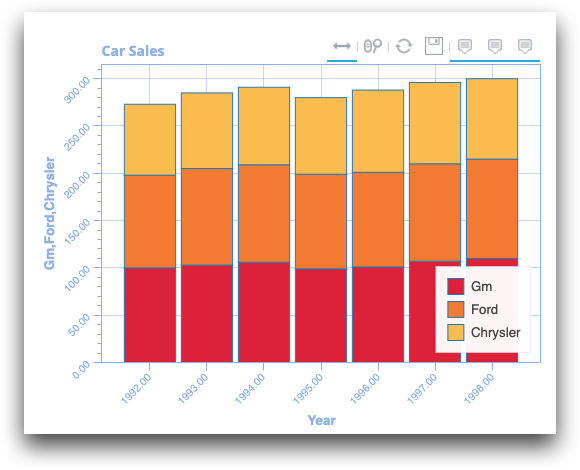
StackBar Chart/HStackBar Chart
A chart with either vertical or horizontal bars where the the proportional values are stacked on top of one another to illustrate the percentage of the entire value.
PercentBar Chart/HPercentBar Chart
Similar to the StackBar Chart, this chart displays the percentage of the total for each segment of the chart, rather than the numerical values. This chart can also be displayed vertically or horizontally.
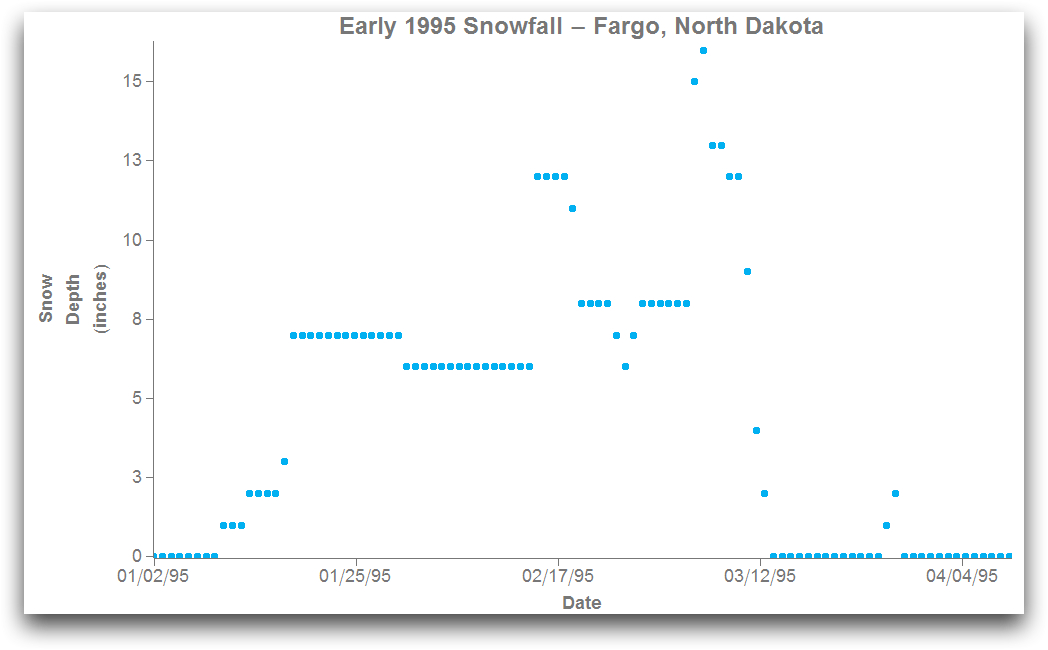
Scatter Plot
A two-dimensional chart that plots a set of related values as a collection of individual data points.
Scatter charts are often used to show the non-linear relationship between variables. They help to visualize the distribution of data points within a particular data set and can help to identify any outliers.
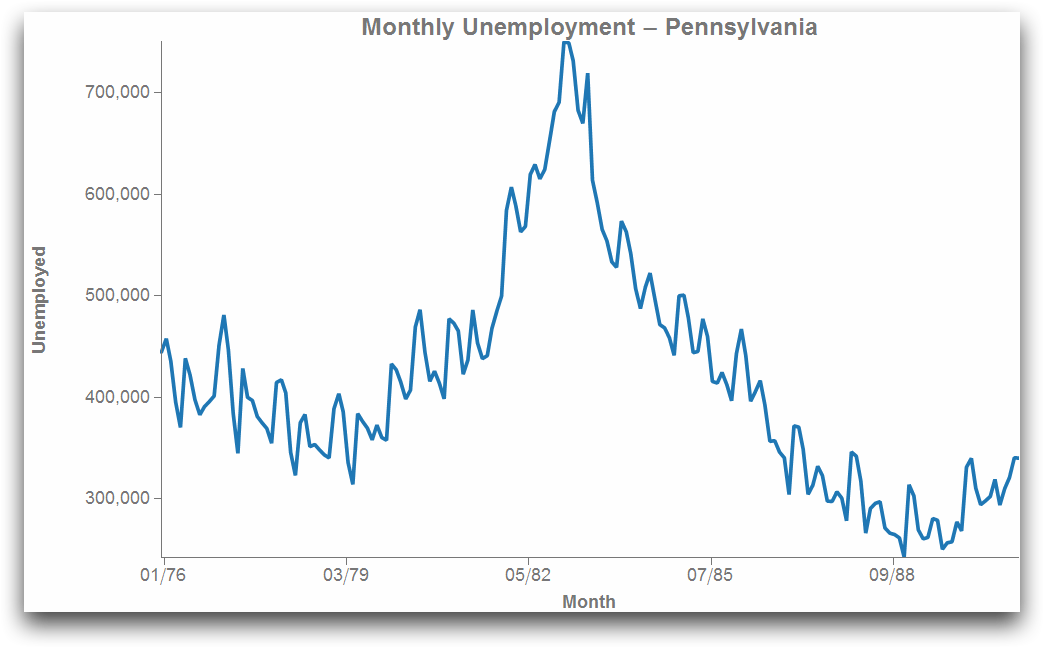
Line Plot
A two-dimensional chart that displays a series of data points interconnected by line segments.
Line charts can show the change in a particular variable over time and are often used to identify trends in data.
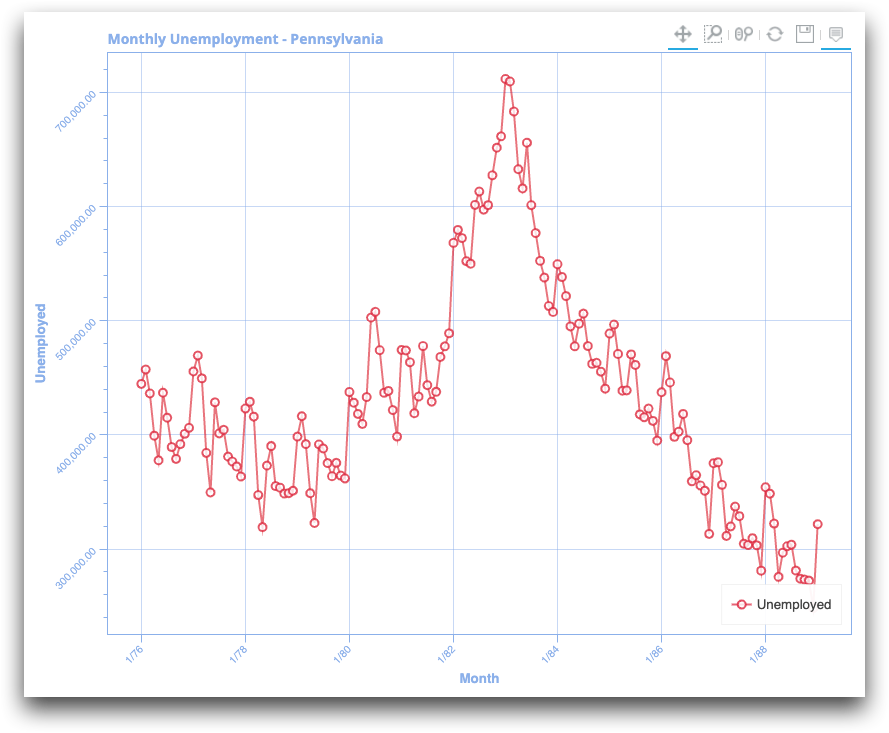
ScatterLine Plot
This chart combines the scatter and the line plots. It shows individual data points, but a line joins the data points together.
Pie Chart
A circular chart that is divided into sections representing various subsets of data in relation to the whole.
Pie charts are used to show the proportional relationship between various subsets of data and are most effective when the number of subsets is relatively small.
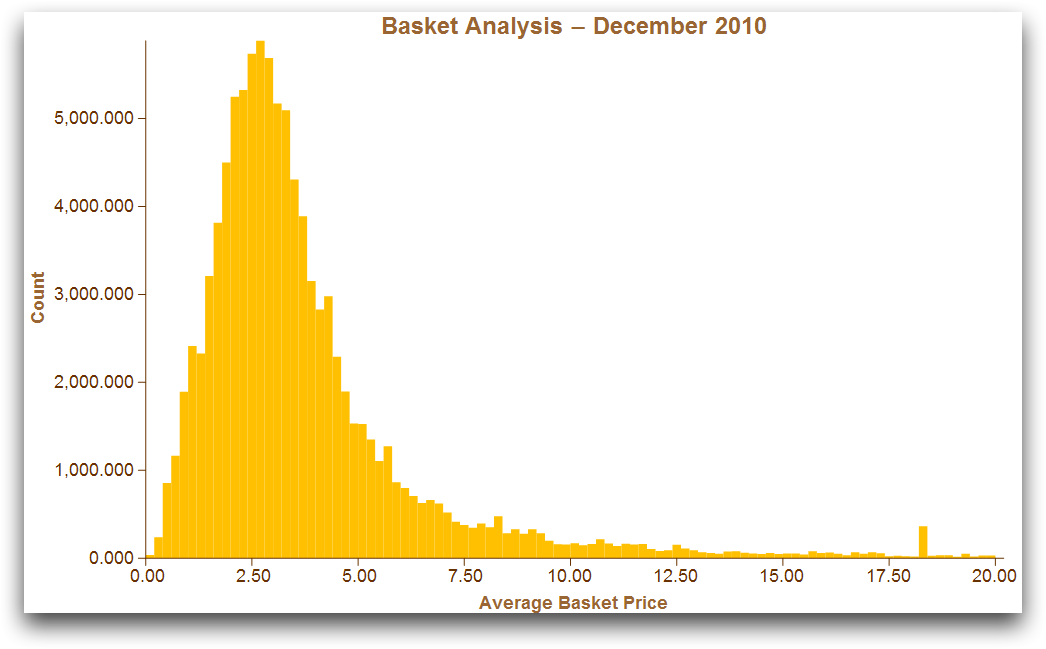
Histogram
A chart that shows the distribution of data using contiguous columns (bins).
The height of each bin, which represents a grouping of data, indicates the frequency of occurrence of that particular group within the given data set.