
Columns panel
Columns available for plotting in a chart are displayed in the columns panel of the chart builder.
The columns panel is located on the right side of the analysis pane in the Visualize tab. The panel contains a list of all the columns from the current table or worksheet.
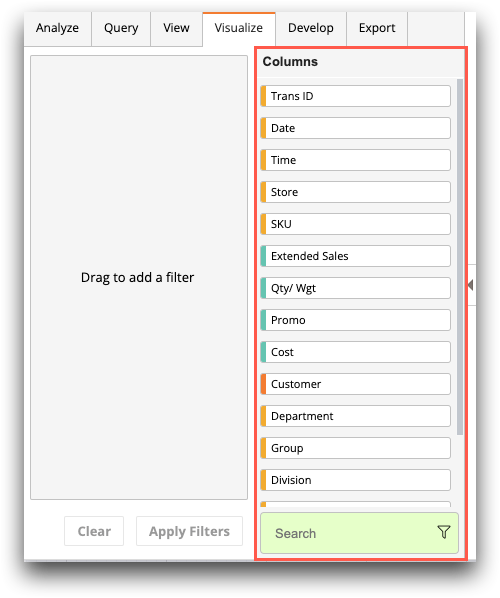
Each column in the panel is identified by its column label. The color on the left side of each column indicates the type of data values in that column. For more information about determining the data type of a column, see Column information.
Any column in the columns panel can be dragged to the filter panel in the analysis pane for selecting a subset of the column data. For more information, see Chart data.