
Filters panel
You can perform certain column filter operations in the filters panel of the chart builder.
The filters panel is located on the left side of the analysis pane in the Visualize tab. Drag and drop columns to the filters panel to filter the column data before creating a chart.
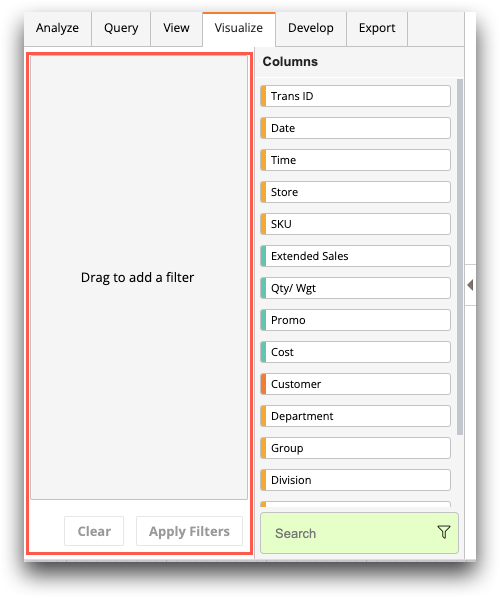
After you drag and drop columns to the filters panel, you can specify a range of values to include in the filter. The initial values depend on the data type and the data in the table.
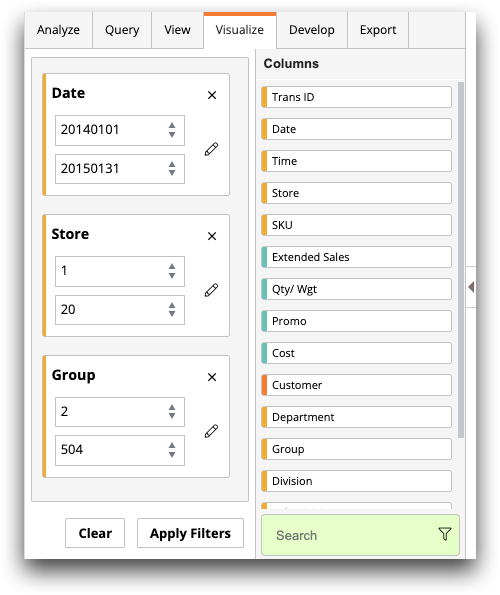
Click Apply Filters when finished.
Note: For more complex selection queries, use the Select operation in the Analysis Timeline, and
then return to the Visualize tab. See the topics under Selecting rows for more information.