
Distribution
The Distribution view displays the frequency, or count of the occurrences, of values in a selected column.
The Distribution view in the results pane is accessed by
right-clicking a cell in the grid and then selecting from the menu.
Note: In this topic, [COLUMN_LABEL]
represents the label of the column in which the selected cell is located.
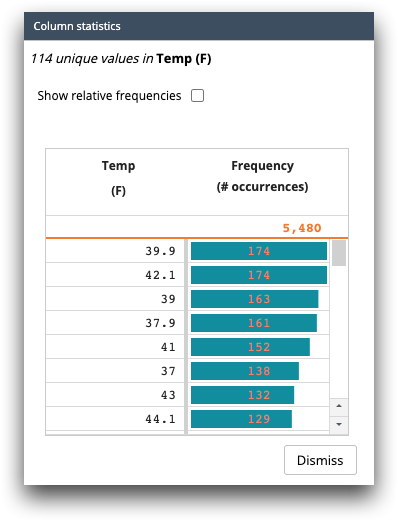
The following information is available in the Distribution view:
- Show relative frequencies
- Select to view each unique value as a percentage of the total count.
- [COLUMN_LABEL]
- The unique values in the selected column.
- Frequency
- The number of times each unique value appears in the selected column. If you choose Show relative frequencies, this column displays the number of times this value appears as a percentage of the total count.