
Use a group metric
Compute an aggregation, grouping rows by one or more columns.
The Group Metric operation panel performs functions similar to basic group functions, or g_functions, in Macro Language, with a simple user interface. Group functions are used to perform various kinds of calculations across a particular set of rows, grouping by unique values, within one or more columns of a table. For example, you can calculate total sales by store or average temperature by city. Group functions are similar to tabulations, but they do not result in loss of granularity of the data.
For more information about g_functions, see Group Functions, as well as the particular
group function, such as g_sum and g_avg, in the
1010data Reference Manual.
To perform an aggregation, or group metric:
-
In the New operation panel, click Group
Metric.
The Trillion-Row Spreadsheet displays the Group Metric panel.
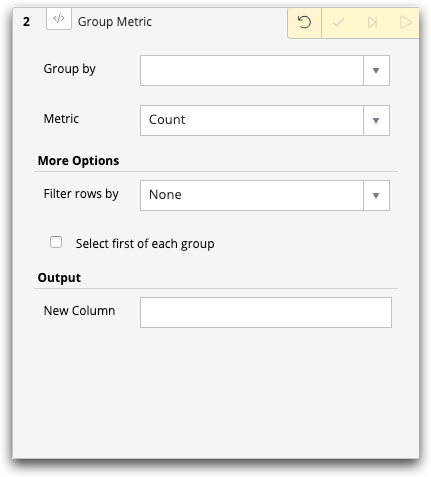
- From the Group by drop-down list, select the column you wish to group by. You can also select Check All to group by all columns.
-
From the Metric drop-down list, select the metric by
which you want to aggregate the group. For example, you may want to count all
the members of the group, in which case you would select
Count. You may want a sum, such as total sales per
store. In this case, you would select the metric of
Sum.
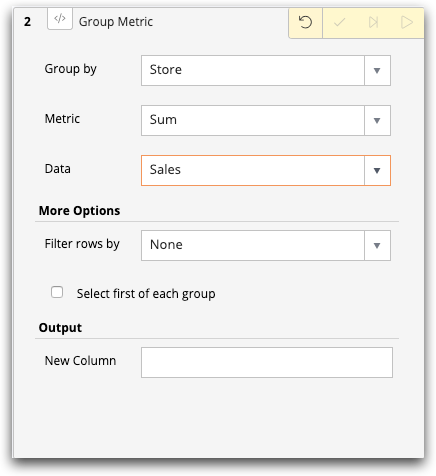
Note: For the definitions of the different metrics, see Types of metrics.Depending on the metric chosen, the Group Metric panel may display one or more additional options. For example, if you choose Sum as the metric, you will have an additional Data drop-down list.
-
Choose the data field on which to perform the metric on the data, such as
performing a metric of Sum on
Sales.
- There may be additional drop-down lists, depending on the metric chosen. For example, if you chose Weighted Average, you would select the column to apply the weighted average and the column supplying the weights.
- Optionally, you can choose to filter rows. The filter row you select must contain boolean values, that is, the value in each row must be either 0 (omit) or 1 (include). If you select the default value of None, all rows are considered in the group metric.
- Optionally, you can display only the first value of each group.
- Enter a name for the new column containing the results of the group metric.
-
Click the Submit operation (
 ) icon.
The Trillion-Row Spreadsheet displays the results of the group metric operation. In this example, Group by is Store, the Metric is Sum, and the Data field is Sales. The new column is for the group metric is sales_by_store.
) icon.
The Trillion-Row Spreadsheet displays the results of the group metric operation. In this example, Group by is Store, the Metric is Sum, and the Data field is Sales. The new column is for the group metric is sales_by_store.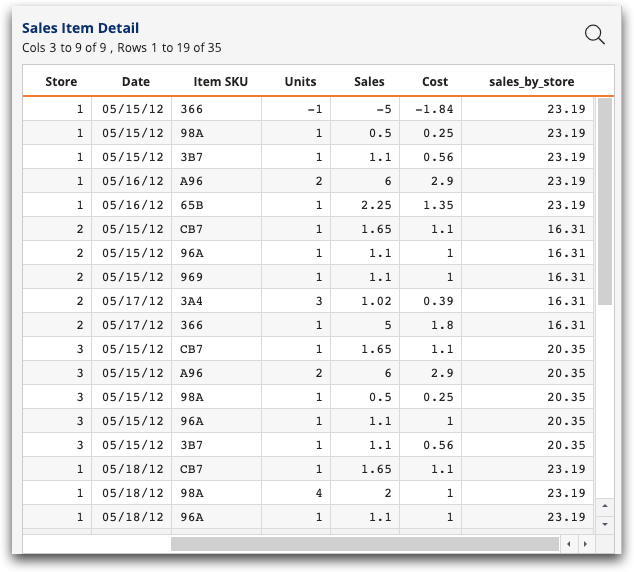
In addition, the name of the panel changes from Group Metric to the more descriptive g_sum by store.