
Chart parameters
Chart-specific settings are displayed in the chart parameters panel of the Chart Builder.
The chart parameters panel, outlined in red below, appears on the right side of the analysis pane in the Visualize tab. This panel is used to select the chart type, specify chart-specific settings, specify the columns of data to be plotted, and enable chart interactions.
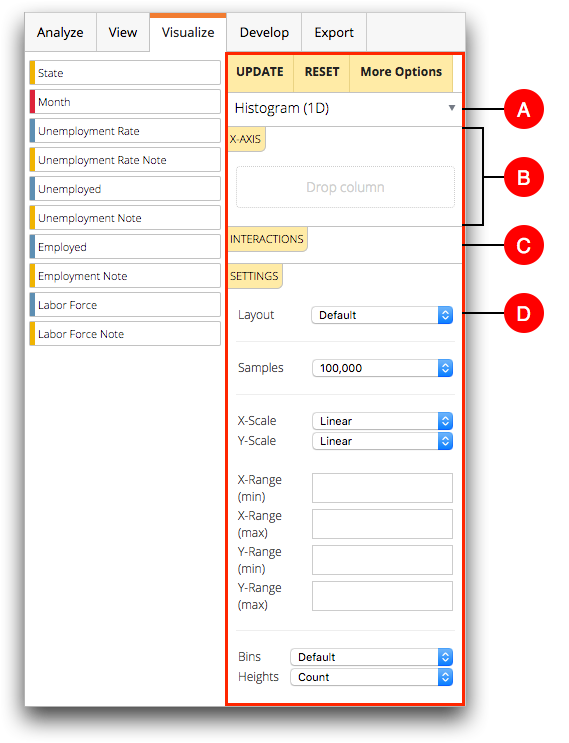
The chart parameters panel consists of the following:
- A. Chart type
- The chart type drop-down list is used to select the type of chart you want to create.
The available fields and options in the other sections of the chart parameters panel are dependant on the chart type selected.
- B. Chart data
- Depending on the selected chart type, one or more chart data sections are displayed. These sections are labeled with the type of data required to plot the selected chart. (e.g., X-AXIS, BARS, LABELS, etc.)
- C. Interactions
- Chart interactions allow you to enable certain mouse actions in the chart. For
example, you can zoom, recenter, or select data points.Note: Chart interactions are provided only for the Line and Scatter chart types.
- D. Settings
- This section displays a number of general parameters related to the chart, such as the number of samples to include in the chart or whether to use a linear or logarithmic scale for a particular axis. Additional options specific to the selected chart type may also appear.