
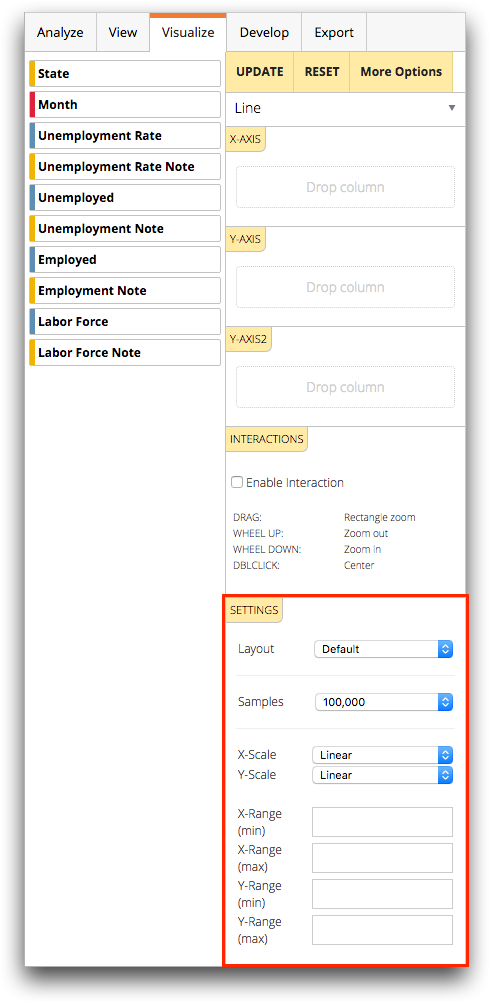
Settings
The Settings section displays a number of general parameters related to the chart, such as the number of samples to include in the chart or whether to use a linear or logarithmic scale for a particular axis.
Fields and options in the Settings section are specific to the chart type selected in the chart type drop-down list. For instance, if you select the Bar chart type, you will see settings for Bar orientation and Layout.
For a detailed listing of the general and chart-specific parameters for each chart type, see the appropriate section below.
Histogram (1D)
Fields and options available for the Histogram (1D) chart type include:
- Layout
-
- Default
- Stacked
- Samples
- Specify the number of samples to use when plotting a chart.
- X-Scale
-
- Linear
- Use a linear scale for the X-axis.
- Log
- Use a logarithmic scale for the X-axis.
- Y-Scale
-
- Linear
- Use a linear scale for the Y-axis.
- Log
- Use a logarithmic scale for the Y-axis.
- X-Range (min)
- Specify the minimum value to be plotted along the X-axis.
- X-Range (max)
- Specify the maximum value to be plotted along the X-axis.
- Y-Range (min)
- Specify the minimum value to be plotted along the Y-axis.
- Y-Range (max)
- Specify the maximum value to be plotted along the Y-axis.
- Bins
- You can select a particular binning method or choose a specific bin size.
The following are the available binning methods:
- Default
- Sturges
- Compute the number of bins based on the length of data
- Scott
- Asymptotically minimize the mean square error
- Freedman-Diaconis
- Twice the interquartile range divided by the cube root of sample size
- Knuth
- Balance likelihood and prior probability of a piecewise uniform model
- Wand
- One-level recursive approximate Wand binning
The following are the available bin sizes:
- 10
- 20
- 50
- 100
- Heights
-
- Count
- The number of values lying in each bin
- Cumulative Count
- Cumulative counts
- Survival Count
- Survival counts
- Probability
- Fraction of values lying in each bin
- CDF
- Cumulative distribution function
- SF
- Survival function
- HF
- Hazard function
- CHF
- Cumulative hazard function
Histogram (2D)
Fields and options available for the Histogram (2D) chart type include:
- Samples
- Specify the number of samples to use when plotting a chart.
- X-Scale
-
- Linear
- Use a linear scale for the X-axis.
- Log
- Use a logarithmic scale for the X-axis.
- Y-Scale
-
- Linear
- Use a linear scale for the Y-axis.
- Log
- Use a logarithmic scale for the Y-axis.
- X-Range (min)
- Specify the minimum value to be plotted along the X-axis.
- X-Range (max)
- Specify the maximum value to be plotted along the X-axis.
- Y-Range (min)
- Specify the minimum value to be plotted along the Y-axis.
- Y-Range (max)
- Specify the maximum value to be plotted along the Y-axis.
- Bins
- You can select a particular binning method or choose a specific bin size.
The following are the available binning methods:
- Default
- Sturges
- Compute the number of bins based on the length of data
- Scott
- Asymptotically minimize the mean square error
- Freedman-Diaconis
- Twice the interquartile range divided by the cube root of sample size
- Knuth
- Balance likelihood and prior probability of a piecewise uniform model
- Wand
- One-level recursive approximate Wand binning
The following are the available bin sizes:
- 10
- 20
- 50
- 100
- Heights
-
- Count
- The number of values lying in each bin
- Cumulative Count
- Cumulative counts
- Survival Count
- Survival counts
- Probability
- Fraction of values lying in each bin
- CDF
- Cumulative distribution function
- SF
- Survival function
- HF
- Hazard function
- CHF
- Cumulative hazard function
Line
Fields and options available for the Line chart type include:
- Layout
-
- Default
- No fill under the plotted line.
- Filled
- Fill the area below the plotted line with color.
- Samples
- Specify the number of samples to use when plotting a chart.
- X-Scale
-
- Linear
- Use a linear scale for the X-axis.
- Log
- Use a logarithmic scale for the X-axis.
- Y-Scale
-
- Linear
- Use a linear scale for the Y-axis.
- Log
- Use a logarithmic scale for the Y-axis.
- X-Range (min)
- Specify the minimum value to be plotted along the X-axis.
- X-Range (max)
- Specify the maximum value to be plotted along the X-axis.
- Y-Range (min)
- Specify the minimum value to be plotted along the Y-axis.
- Y-Range (max)
- Specify the maximum value to be plotted along the Y-axis.
Scatter
Fields and options available for the Scatter chart type include:
- Layout
-
- Default
- Scatter points appear as separate entities on the chart.
- Filled
- A line extends from each scatter point to the X-axis.
- Samples
- Specify the number of samples to use when plotting a chart.
- X-Scale
-
- Linear
- Use a linear scale for the X-axis.
- Log
- Use a logarithmic scale for the X-axis.
- Y-Scale
-
- Linear
- Use a linear scale for the Y-axis.
- Log
- Use a logarithmic scale for the Y-axis.
- X-Range (min)
- Specify the minimum value to be plotted along the X-axis.
- X-Range (max)
- Specify the maximum value to be plotted along the X-axis.
- Y-Range (min)
- Specify the minimum value to be plotted along the Y-axis.
- Y-Range (max)
- Specify the maximum value to be plotted along the Y-axis.
Bar
Fields and options available for the Bar chart type include:
- Bar orientation
-
- Default
- Bars are displayed vertically in the chart.
- Horizontal
- Bars are displayed horizontally in the chart.
- Layout
-
- Default
- Each grouping in a particular data set is displayed as a separate bar in the chart.
- Stacked
- All of the related groupings of data in a particular data set are stacked on top of one another contiguously in a single bar.
- Stepped
- All of the related groupings of data in a particular data set are displayed next to one another in an ascending series of separate bars.
- Percentile
- All of the related groupings of data in a particular data set are stacked on top of one another contiguously in a single bar; the height of each grouping in the bar corresponds to its value in relation to the other groupings in the same data set.
- Samples
- Specify the number of samples to use when plotting a chart.
- Y-Scale
-
- Linear
- Use a linear scale for the Y-axis.
- Log
- Use a logarithmic scale for the Y-axis.
- Y-Range (min)
- Specify the minimum value to be plotted along the Y-axis.
- Y-Range (max)
- Specify the maximum value to be plotted along the Y-axis.
Pie
Fields and options available for the Pie chart type include:
- Layout
-
- Default
- Pie slices extend into the center of the chart.
- Donut
- The center of the chart is empty, providing the data in the shape of a ring.
- Samples
- Specify the number of samples to use when plotting a chart.
Bubble
Fields and options available for the Bubble chart type include:
- Samples
- Specify the number of samples to use when plotting a chart.
- X-Scale
-
- Linear
- Use a linear scale for the X-axis.
- Log
- Use a logarithmic scale for the X-axis.
- Y-Scale
-
- Linear
- Use a linear scale for the Y-axis.
- Log
- Use a logarithmic scale for the Y-axis.
- X-Range (min)
- Specify the minimum value to be plotted along the X-axis.
- X-Range (max)
- Specify the maximum value to be plotted along the X-axis.
- Y-Range (min)
- Specify the minimum value to be plotted along the Y-axis.
- Y-Range (max)
- Specify the maximum value to be plotted along the Y-axis.
Scatter (3D)
Fields and options available for the Scatter (3D) chart type include:
- Layout
-
- Default
- Filled
- Joined
- Samples
- Specify the number of samples to use when plotting a chart.
- X-Scale
-
- Linear
- Use a linear scale for the X-axis.
- Log
- Use a logarithmic scale for the X-axis.
- Y-Scale
-
- Linear
- Use a linear scale for the Y-axis.
- Log
- Use a logarithmic scale for the Y-axis.
- Z-Scale
-
- Linear
- Use a linear scale for the Z-axis.
- Log
- Use a logarithmic scale for the Z-axis.
- X-Range (min)
- Specify the minimum value to be plotted along the X-axis.
- X-Range (max)
- Specify the maximum value to be plotted along the X-axis.
- Y-Range (min)
- Specify the minimum value to be plotted along the Y-axis.
- Y-Range (max)
- Specify the maximum value to be plotted along the Y-axis.
- Z-Range (min)
- Specify the minimum value to be plotted along the Z-axis.
- Z-Range (max)
- Specify the maximum value to be plotted along the Z-axis.
Surface
Fields and options available for the Surface chart type include:
- Samples
- Specify the number of samples to use when plotting a chart.
- X-Scale
-
- Linear
- Use a linear scale for the X-axis.
- Log
- Use a logarithmic scale for the X-axis.
- Y-Scale
-
- Linear
- Use a linear scale for the Y-axis.
- Log
- Use a logarithmic scale for the Y-axis.
- Z-Scale
-
- Linear
- Use a linear scale for the Z-axis.
- Log
- Use a logarithmic scale for the Z-axis.
- X-Range (min)
- Specify the minimum value to be plotted along the X-axis.
- X-Range (max)
- Specify the maximum value to be plotted along the X-axis.
- Y-Range (min)
- Specify the minimum value to be plotted along the Y-axis.
- Y-Range (max)
- Specify the maximum value to be plotted along the Y-axis.
- Z-Range (min)
- Specify the minimum value to be plotted along the Z-axis.
- Z-Range (max)
- Specify the maximum value to be plotted along the Z-axis.
Candlestick
Fields and options available for the Candlestick chart type include:
- Samples
- Specify the number of samples to use when plotting a chart.
Kagi
Fields and options available for the Kagi chart type include:
- Samples
- Specify the number of samples to use when plotting a chart.
Renko
Fields and options available for the Renko chart type include:
- Samples
- Specify the number of samples to use when plotting a chart.
Point & Figure
Fields and options available for the Point & Figure chart type include:
- Samples
- Specify the number of samples to use when plotting a chart.
Line Break
Fields and options available for the Line Break chart type include:
- Samples
- Specify the number of samples to use when plotting a chart.