Perform a quick summary
A quick summary is a type of tabulation that allows you to easily perform calculations, called summarizations, on one or more columns.
Oftentimes, you may want to determine the total of all the values in a particular column or the average of those values. Or perhaps you want to find the highest or lowest value in a column. A quick summary allows you to perform summarizations on one or more columns in a table or worksheet to ascertain these quantities.
To perform a quick summary:
-
Open the Tabulation panel by doing one of the
following.
- In the New operation panel, click Tabulate.
- In the grid, right-click a cell within the column on which you want to
base the quick summary, point to , and select a summarization option.
For a list and description of options available from the grid, see Summarization options in the grid menu.
Note: In this topic, [COLUMN_LABEL] represents the label of the column in which the selected cell is located.The Trillion-Row Spreadsheet displays the Tabulation panel.Note: The Tabulation panel available in the grid is visually different from the panel in the Analysis Timeline. While the panels vary slightly from one another, the available fields and functionality is identical. For illustration purposes, this topic shows images of the Tabulation panel as it appears in the timeline.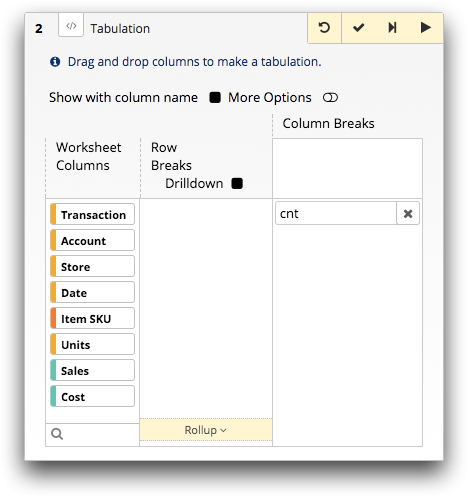 Note: By default, when opened from the New operation panel, the Tabulation panel contains the cnt (count) tabulation function. Otherwise, the New operation panel contains the summarization selected from the grid menu.
 -
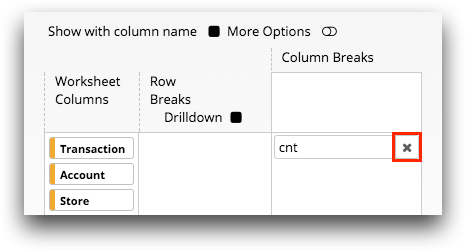
If applicable, remove the default tabulation function by clicking the
Delete Function (
 ) icon in
the field.
) icon in
the field.
-
For each column of data that you want to summarize, complete the
following:
-
Drag the column from the Worksheet Columns
section to the lower area of the Column Breaks
section.
This selection chooses the column of data you want to summarize.
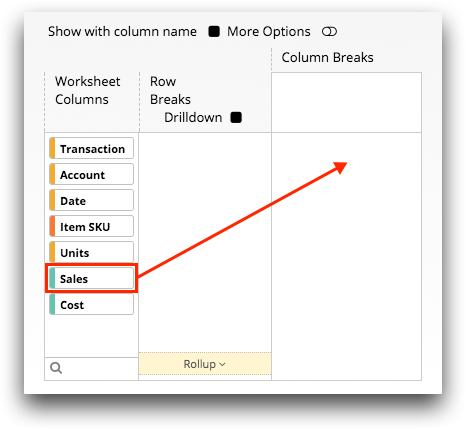 The Trillion-Row Spreadsheet adds a tabulation function field and returns the column to the Worksheet Columns section.Note: By default, columns placed in the lower area of the Column Breaks section are assigned the sum of [COLUMN] summarization. If the data type of the column is text, it is assigned the last of [COLUMN] summarization.
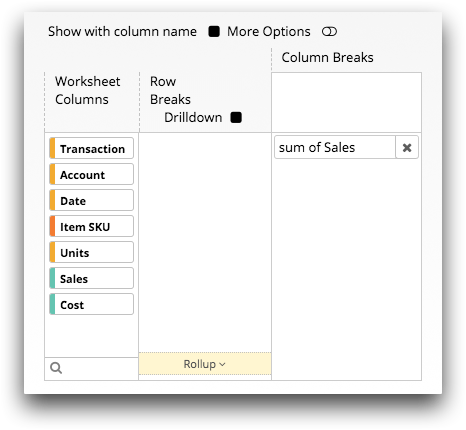
-
Drag the column from the Worksheet Columns
section to the lower area of the Column Breaks
section.
By default, columns in the resultant worksheet are named
t0, t1, t2, and so on. You
can give tabulated columns more meaningful names within the More
Options view of the Tabulation panel. In
addition, you can define the various formats of the tabulation
results.-
Optionally, define the format of the tabulation results.
For instructions, see Format the tabulation results.
-
Click the Submit operation (
 ) icon.
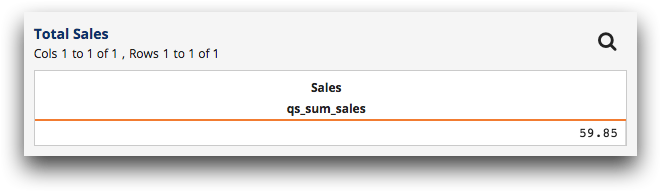
The Trillion-Row Spreadsheet displays the results of your quick summary.
) icon.
The Trillion-Row Spreadsheet displays the results of your quick summary.