
Tabulation panel
The Tabulation panel allows you to perform any of the three basic types of tabulations (quick summaries, tabulations, and cross tabulations) to analyze your data.
- Analysis Timeline in the Trillion-Row Spreadsheet
- Right-click menu in the grid
It is important to note that the Tabulation panel available in the grid is visually different from the panel in the Analysis Timeline. While the panels vary slightly from one another, the available fields and functionality is identical. For illustration purposes, this topic shows images of the Tabulation panel as it appears in the timeline.
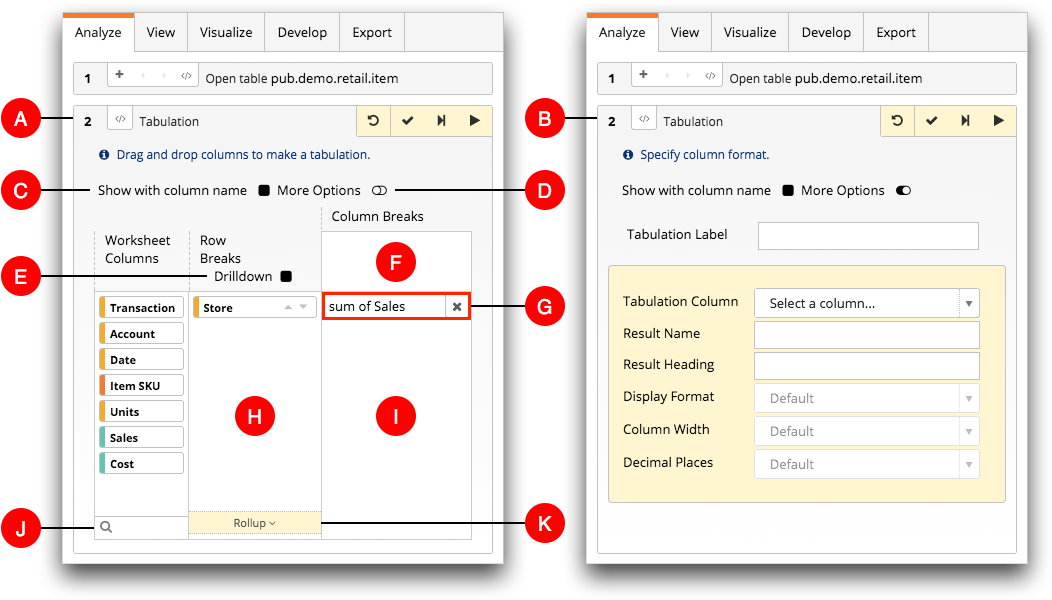
- A. Edit panel view
- In the image above on the left, the Tabulation operation is
open in the edit panel view.
Use the edit panel view to configure a new tabulation or make changes to an existing tabulation in the timeline. By default, a new Tabulation panel opens in the edit panel view.
- B. More options view
- In the image above on the right, the Tabulation operation is
open in the more options view. For a list of format fields and options, see Tabulation result options.
This view displays the options available to format the tabulation results. For example, you can give tabulated columns meaningful names and define the various format options of the tabulation. For instructions, see Format the tabulation results.
- C. Show with column name
- Select this option to display the column name instead of the column label within the column biscuits and the Tabulation Function menu in the panel. Column labels are displayed by default in a new Tabulation panel.
- D. More Options
- This switch controls whether the edit panel view or the more options view of the
Tabulation panel is displayed.
When the switch is off (to the left), the edit panel view is displayed. When the switch is on (to the right), the more options view is displayed. By default, the switch in a new Tabulation panel is off. You can submit a tabulation operation when either panel view is displayed.
- E. Drilldown
- This option allows you to add a drilldown hierarchy to a tabulation or cross tabulation. The drilldown hierarchy is defined by the order of the specified columns in the Row Breaks section. After the operation is submitted, you can use the Grid view to perform a drilldown analysis on the results. For more information, see Drilldown analysis.
- F. Upper area of the Column Breaks section
- The upper area of the Column Breaks section is used to create
a cross tabulation.
When at least one column biscuit is in the Row Breaks section and at least one tabulation function is in the lower area of the Column Breaks section, drag at least one column biscuit to the upper area to perform a cross tabulation. For instructions, see Perform a cross tabulation.
- G. Tabulation function
- The tabulation function field defines the calculation, called a summarization, in a
quick summary, tabulation, or cross tabulation. You can add multiple summarizations to
any of the three types of tabulations.
Clicking the tabulation function field displays the Tabulation Function menu which allows you to select the type of summarization you want to perform. For a list of available tabulation functions, see Types of summarizations.
- H. Row Breaks section
- The Row Breaks section is used to create a tabulation.
Drag at least one column biscuit into this section to create a tabulation. For instructions, see Perform a tabulation.
- I. Lower area of the Column Breaks section
- The lower area of the Column Breaks section is used to set
the tabulation function for the quick summary, tabulation, or cross tabulation.
Note: By default, a new Tabulation panel contains the cnt (count) tabulation function.
When a column biscuit is dragged into the lower area of the Column Breaks section, a tabulation function is created for that column. By default, columns placed in the lower area of the Column Breaks section are assigned the sum of [COLUMN] summarization. If the data type of the column is text, it is assigned the last of [COLUMN] summarization. To remove a tabulation function, click the Delete Function (
 ) icon in
the tabulation function field.
) icon in
the tabulation function field.Drag at least one column biscuit to the lower area of the Column Breaks section, without placing any columns in either the Row Breaks or Column Breaks sections, to perform a quick summary. For instructions, see Perform a quick summary.
- J. Column filter
- The column filter field is used to limit the number of column biscuits that appear in the Worksheet columns section. This is useful when locating a specific column in a table or worksheet that has many columns. For instructions, see Filter a list of columns.
- K. Rollup bar
- The Rollup bar is used to group like values when performing a
tabulation with row breaks. A rollup makes it easy to aggregate data at multiple
levels in a tabulation. For instructions, see Use a rollup in a tabulation.Note: The rollup feature is not available in a cross tabulation.