Drilldown analysis
A drilldown analysis provides an interactive way to explore data points and view row-level data in the grid without changing your underlying query.
When performing a tabulation or cross tabulation, you have the option of creating a drilldown analysis from the results. To create a drilldown analysis, you must first set up a drilldown hierarchy in the Tabulation panel within the Trillion-Row Spreadsheet timeline. After the operation is submitted, the drilldown analysis is displayed in the Grid view. You can then use the drilldown controls in the grid to easily traverse the results of your analysis to look at different aspects of the data.
See the example below for an explanation of how a drilldown hierarchy could be used in an analysis.
Example
This example illustrates the use of a simple drilldown hierarchy, set up in the Tabulation panel of the Trillion-Row Spreadsheet timeline, to perform a drilldown analysis within the Grid view.
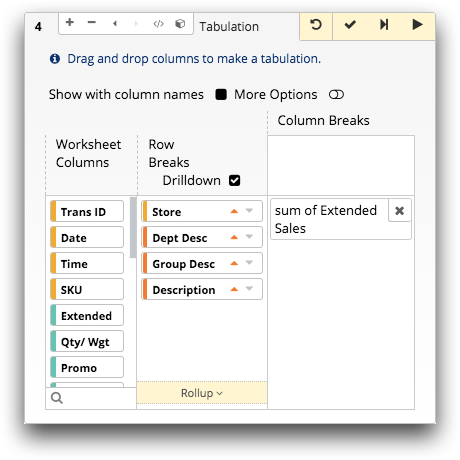
For example, you may want to "drill down" into your sales item detail data to see which product most contributed to the overall sales at a store in a grocery chain. This is accomplished by adding a drilldown hierarchy to a tabulation operation. The drilldown hierarchy in the Tabulation panel is set up by selecting the Drilldown option and then dragging the desired columns into the Row Breaks section.
- Store
- Dept Desc
- Group Desc
- Description
As each item is added to the drilldown, the Trillion-Row Spreadsheet automatically sets the column sort controls to display the results in ascending order.
After defining the drilldown hierarchy, setting the tabulation function, and submitting the operation, the Trillion-Row Spreadsheet updates the grid to show the total amount of sales for each store. This occurs because Store was set as the first item in the drilldown hierarchy.
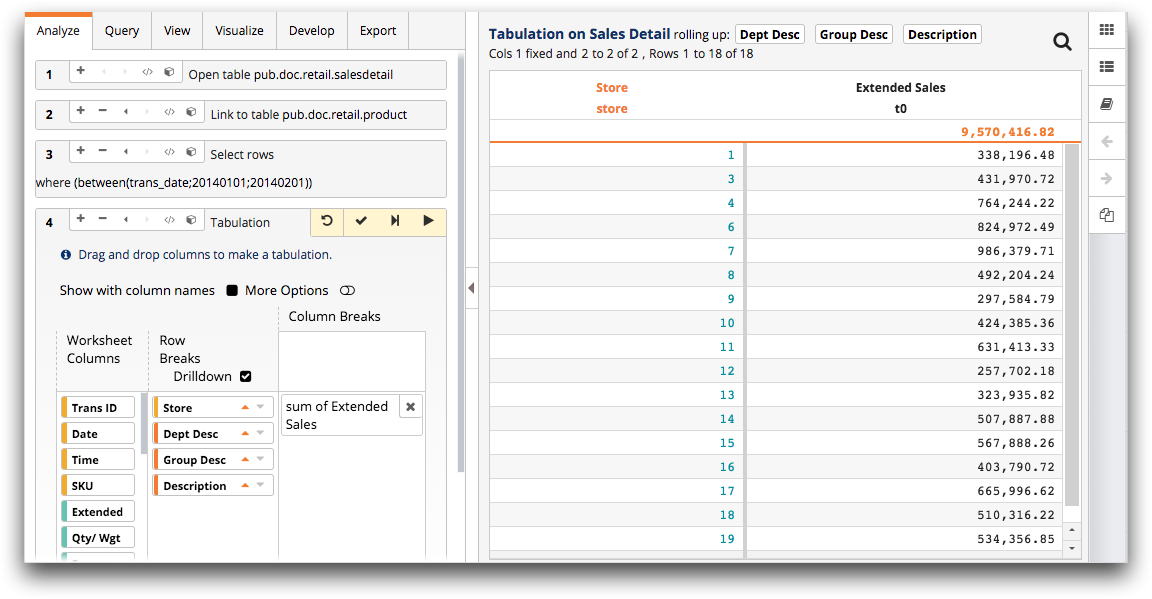
Values in the Store column are blue, signifying that each value is a link. The presence of links indicates that an additional level of detail is available for the value. In addition, the buttons located at the top of the grid display the remaining tabulation drilldown levels.
Clicking a link in the Store column allows you to "drill down" into the next level of detail in the tabulation. When you drill down into another level, the Trillion-Row Spreadsheet adds the appropriate select operation to the timeline, just before the tabulation, and updates the results in the grid. For example, clicking 3 updates the grid to show the total amount of sales for each department (the second level in the drilldown hierarchy) at store 3.
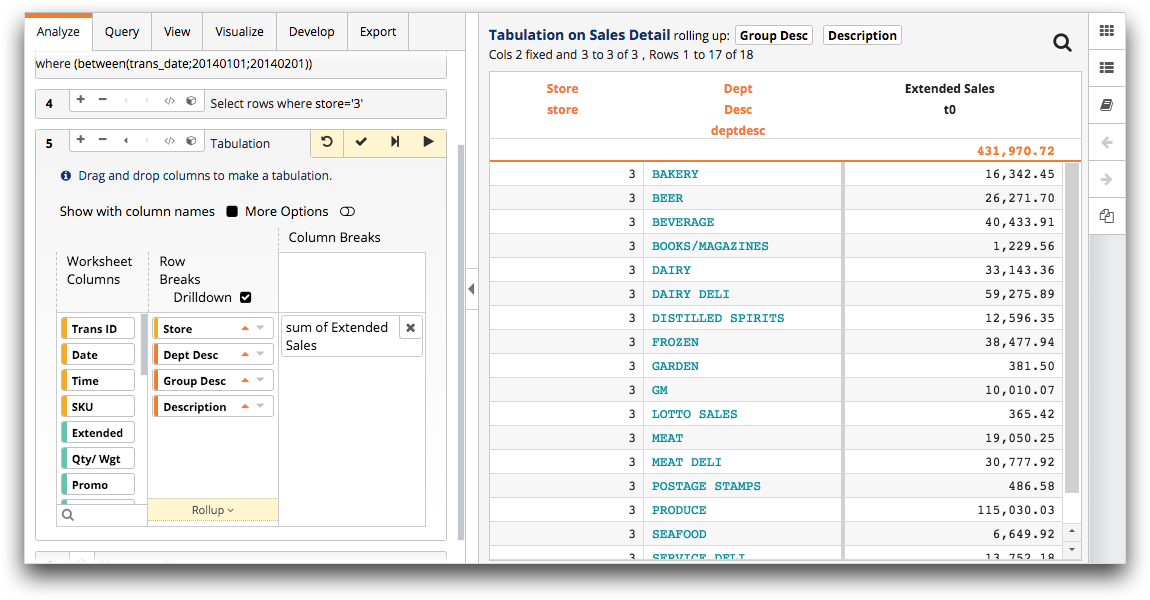
From the results, it is easy to see that the produce department contributed most to the overall sales at the store.
Like the values in the Store column discussed above, links in Dept Desc indicate that another level of detail is available for each department. The buttons above the grid show that the next level in the drilldown is the group description.
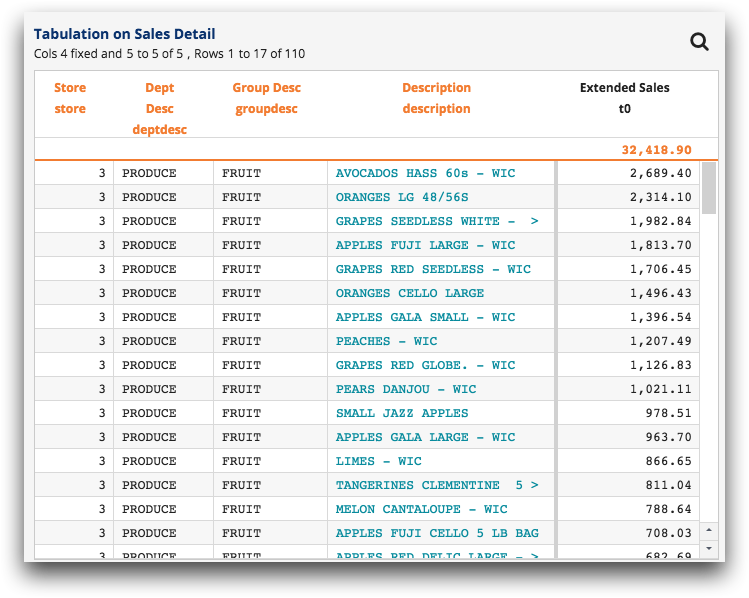
Clicking PRODUCE updates the grid and shows the total amount of sales for each group (the third level in the drilldown hierarchy) in the produce department.
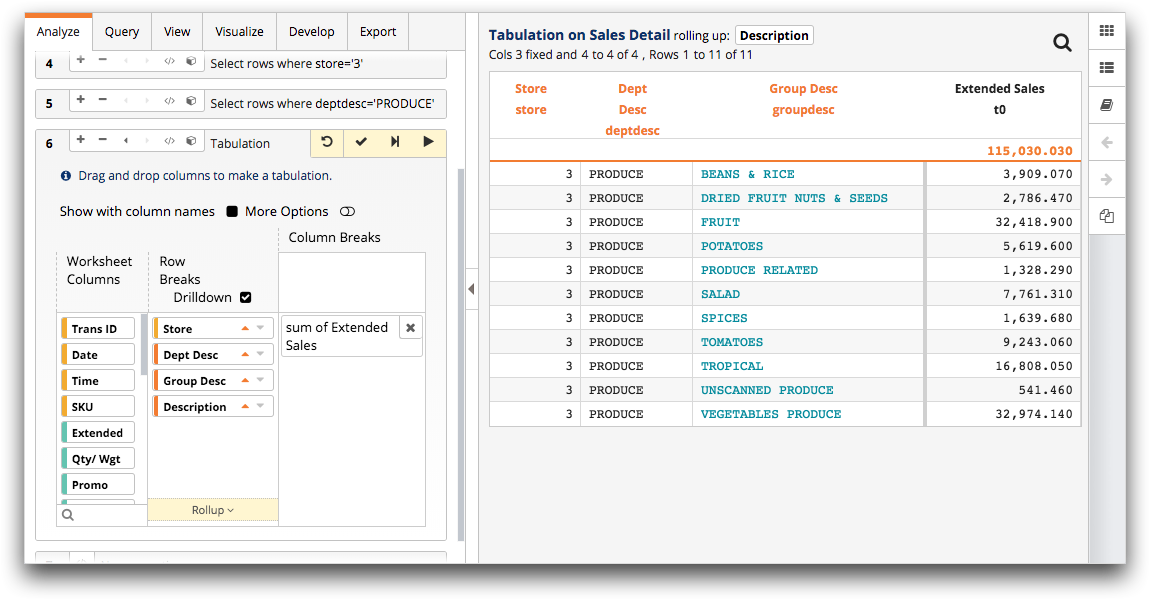
Although the totals are close, the results show that the vegetables group made up the bulk of the sales amount in the produce department; the fruit group was a close second. To see which product contributed most to the store sales, you can drill into the vegetable group.
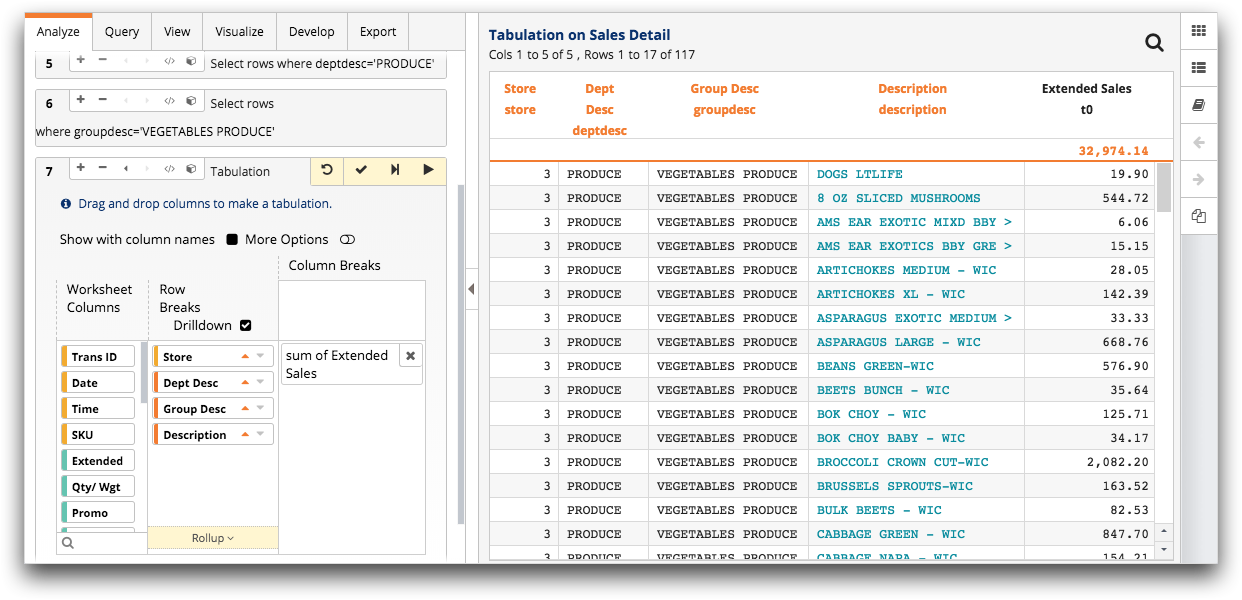
Clicking VEGETABLES PRODUCE updates the grid and shows the total amount of sales for each product (the last level in the drilldown hierarchy) in the vegetable group.
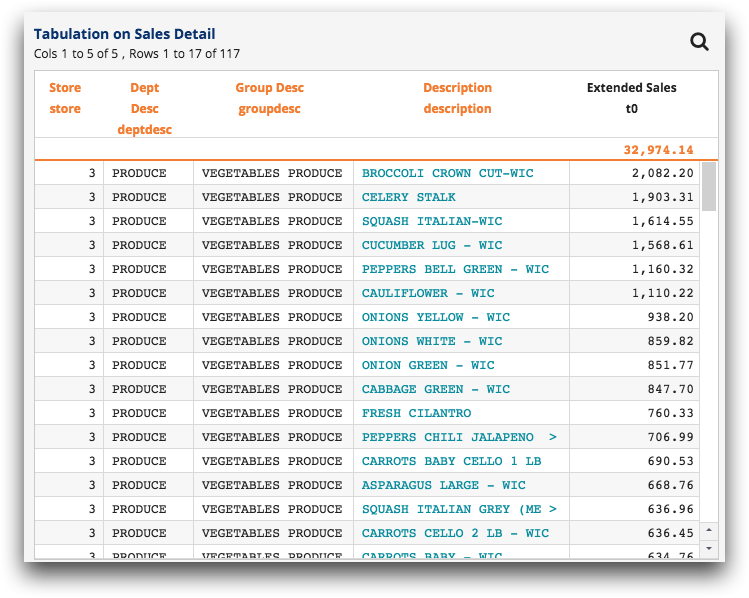
After sorting the results by the Extended Sales column, you can see that broccoli is the top contributor to the total sales at store 3.
In the column header row of the grid, orange column labels and column names are drill-up links. You can click the link to return, or "drill up," to the previous level of detail in the results. This allows you to easily traverse the drilldown hierarchy to look at different aspects of the data.
When you drill up into a previous level, the Trillion-Row Spreadsheet removes the appropriate select operation from the timeline and updates the results in the grid. For example, at this point of the analysis, clicking Description in the column header row updates the grid to, once again, show the total amount of sales for each group in the produce department.
Because the fruit group was a close second, you might be interested to learn which item in that group contributed most to the store sales. To see which product contributed the second most to the store sales, you can drill into the fruit group.
Clicking FRUIT updates the grid and shows the total amount of sales for each product in the fruit group.
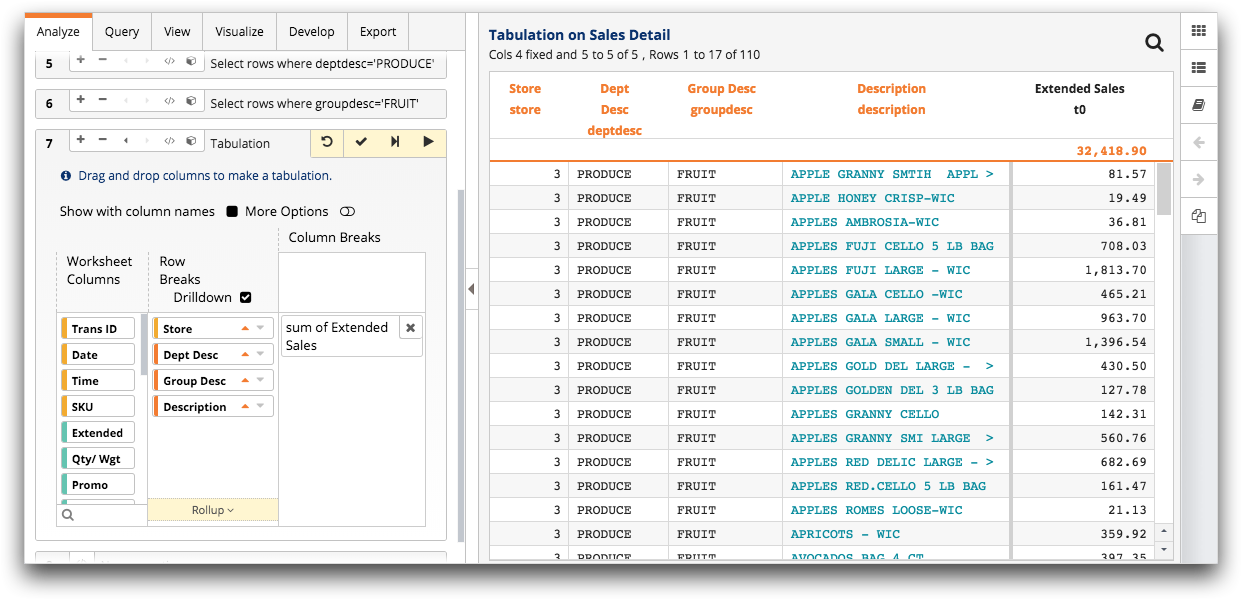
After sorting the results by the Extended Sales column, you can see that avocados are the next top contributor to the total sales at store 3.