
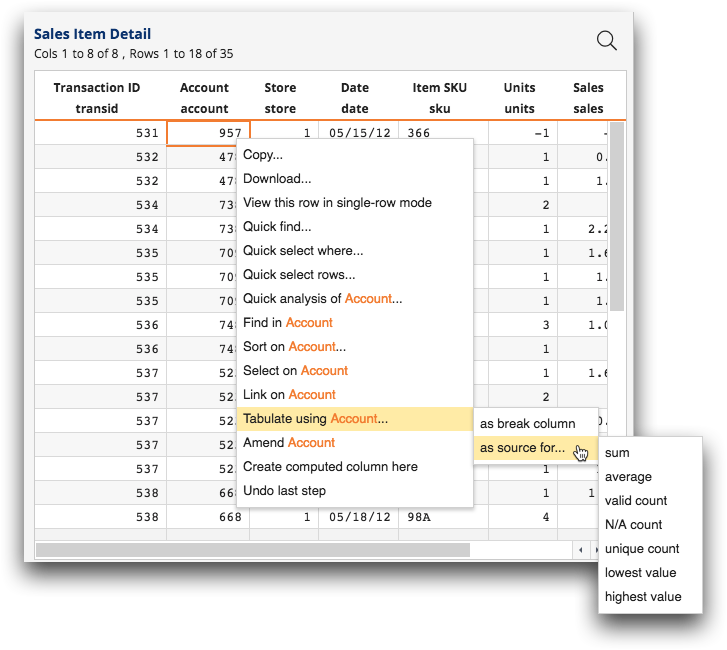
Summarization options in the grid menu
The grid menu provides a list of common calculations, called summarizations, from which to choose when creating a quick summary directly in the grid.
You can choose from the following types of summarizations when performing a quick summary
in the grid.
Note: In the list below, [COLUMN] indicates either the
column name or the column label of the selected column. By default, the column label is
displayed. However, when the Show with column names option is
selected in the Tabulation panel, the column name is displayed
instead.
- sum
- The subtotal of the column for each group. (numeric columns only)
- If a group contains N/A values, those rows are ignored (i.e., the result is the sum of the non-N/A values).
- If a group contains only N/A values, the result for the group is 0.
Note: This option adds the sum of [COLUMN] tabulation function field to the lower area of the Column Breaks section in the Tabulation panel. - average
- The average of the column for each group. (numeric columns only)
- If a group contains N/A values, those rows are ignored (i.e., the result is the average of the non-N/A values).
- If a group contains only N/A values, the result for the group is N/A.
Note: This option adds the avg of [COLUMN] summarization to the lower area of the Column Breaks section in the Tabulation panel. - valid count
- The number of non-N/A values in the column for each group.Note: This option adds the valcnt of [COLUMN] summarization to the lower area of the Column Breaks section in the Tabulation panel.
- N/A count
- The number of N/A values in the column for each group.Note: This option adds the nacnt of [COLUMN] summarization to the lower area of the Column Breaks section in the Tabulation panel.
- unique count
- The number of unique values in the column for each group.
- If a group contains N/A values, those rows are ignored (i.e., the result is the number of unique non-N/A values).
- If a group contains only N/A values, the result for the group is 0.
Note: This option adds the ucnt of [COLUMN] summarization to the lower area of the Column Breaks section in the Tabulation panel. - lowest value
- The lowest number in the column for each group. (numeric columns only)
- If a group contains N/A values, those rows are ignored (i.e., the result is the lowest non-N/A value).
- If a group contains only N/A values, the result for the group is N/A.
Note: This option adds the lo of [COLUMN] summarization to the lower area of the Column Breaks section in the Tabulation panel. - highest value
- The highest number in the column for each group. (numeric columns only)
- If a group contains N/A values, those rows are ignored (i.e., the result is the highest non-N/A value).
- If a group contains only N/A values, the result for the group is N/A.
Note: This option adds the hi of [COLUMN] summarization to the lower area of the Column Breaks section in the Tabulation panel.