class_="graphics"
Using <widget class_="graphics"> creates a graph generated by
1010data's visualization engine.
Syntax
<dynamic>
    <widget class_="graphics">
        [1010data_QUERY]
    </widget>
</dynamic>
The [1010data_QUERY] may be specified between the
opening and closing tags of the <widget>. The results of the query
provide data for the <widget> to display.
Attributes
interactive_- Accepts a
0for off and1for on. Determines whether the end-user can interact with the plot/chart. Interactions include zoom and pan.Note: Theinteractive_attribute currently only works with line charts and scatter charts. label_- Accepts text. Provides a title for your graph.
tooltips_- Accepts
0to turn off (default) and1to activate. When active, the elements of a chart will show the coordinates in the graph they represent when moused over.
drillable_- Accepts a comma-separated list of column names. Any data elements from those columns
are drillable in the widget.
This attribute is typically used to allow the user to drill down into hierarchies defined by the specified columns.
See the
drillvalue_,drillselector_, andpkgdrillvalue_attributes for additional information. drillvalue_- When a data element in a drillable column is clicked, the value of the data element is
appended to a comma-separated string stored in the dynamic variable associated with this
attribute.
The variable must be declared in the opening
<dynamic>tag of the QuickApp (e.g.,<dynamic var_name="">). drillselector_- When a data element in a drillable column is clicked, the name of the column is
appended to a comma-separated string stored in the dynamic variable associated with this
attribute.
The variable must be declared in the opening
<dynamic>tag of the QuickApp (e.g.,<dynamic var_name="">). pkgdrillvalue_- Accepts a dynamic variable that stores drillable-related information for the widget as
key/value pairs in a package. If you use
pkgdrillvalue_, you do not need to usedrillselector_ordrillvalue_.The variable must be declared as a package in the opening
<dynamic>tag of the QuickApp in which the widget exists. It should be initialized as<dynamic var_name="{pkg('sel' 'val';lst() lst())}">.The package contains the following keys and their associated values:sel- A list-value consisting of the drillable columns that have been
clicked.
When a data element in a drillable column is clicked, the name of the column is appended to this list-value.
val- A list-value consisting of the values in the drillable columns that have been
clicked.
When a data element in a drillable column is clicked, the value of the data element is appended to this list-value.
Note: It is highly encouraged to usepkgdrillvalue_instead ofdrillvalue_when cells in drillable columns contain commas. Otherwise, errors will occur when the item containing the comma is added to the comma-separated string stored indrillvalue_.
In addition to the attributes listed above, there are numerous output
configuration options available via the <render> element. For a full
list of configurable output attributes and values, see <render>.
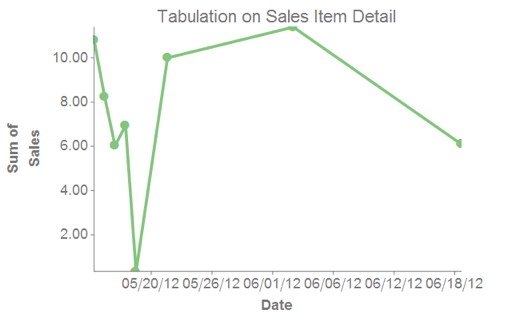
Example: Sales over time
In this example a line graph is generated to display total sales over time. Note that one of the more effective ways to plot data is to first arrive at an aggregation. In this case, the query that results in the data for the graph is a tabulation. The date is the break column and sales are aggregated as a total for each date.
<dynamic>
    <widget base_="pub.demo.retail.item" class_="graphics"
     label_="Store Selection">
        <tabu label="Tabulation on Sales Item Detail" breaks="date">
          <tcol source="sales" fun="sum" label="Sum of`Sales"/>
        </tabu>
    </widget>
</dynamic>
The results appear as follows:
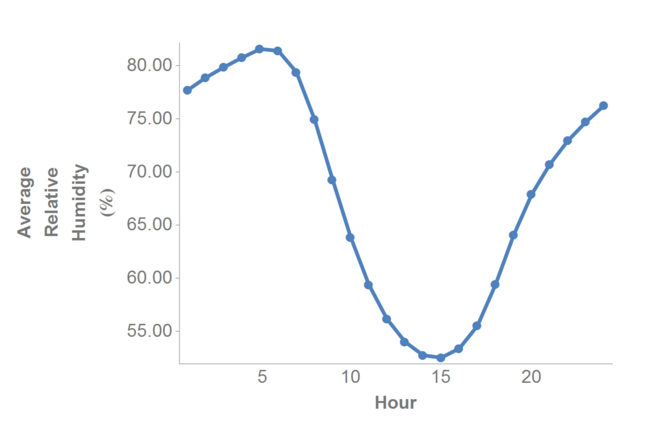
Example: Sine wave
<dynamic>
    <widget base_="pub.demo.weather.hourly90" class_="graphics" margin_="10">
        <sel value="(hum<>999)"/>
        <tabu label="Tabulation on Hourly U.S. Weather (1990)" breaks="hour">
            <tcol source="hum" fun="avg"
             label="Average`Relative`Humidity`(%)"/>
        </tabu>
        <graphspec width="600" height="400">
            <chart type="line">
                <data x="hour" y="t0"/>
            </chart>
            <style
             titlesize="24" titlefontfamily="helvetica" titlefontweight="bold"
             xaxissize="18" xaxisfontfamily="helvetica" xaxislabelsize="18"
             xaxislabelfontfamily="helvetica" xaxislabelfontweight="bold"
             yaxissize="18" yaxisfontfamily="helvetica" yaxislabelsize="18"
             yaxislabelfontfamily="helvetica" yaxislabelfontweight="bold"
             zaxissize="18" zaxisfontfamily="helvetica" zaxislabelsize="18"
             zaxislabelfontfamily="helvetica" zaxislabelfontweight="bold"/>
        </graphspec>
    </widget>
</dynamic>