<graphspec>
The <graphspec> element is contained by a
<widget> of class_="graphics".
<graphspec> allows you to specify various chart-related properties such as
type, legend position, axes labels, width, height, and theme.
Syntax
<dynamic>
    <widget class_="graphics">
      [1010data_QUERY]
      <graphspec>
        <chart>
          <data x="" y=""/>
          <legend/>
          <axes/>
          <ticks/>
        </chart>
        <style/>
      </graphspec>
    </widget>
</dynamic>
Attributes
format- Specifies the format in which to export the chart.
For a list of valid formats, see Export formats.
The default is
png. width- Specifies the width of the
<graphspec>area in the unit of pixels.If the
<graphspec>element is nested inside a<widget>element, then thiswidthattribute is ignored, and the dimensions of the<widget>are applied.Valid values range from 1-4096.
The default is 600.
height- Specifies the height of the
<graphspec>area in the unit of pixels.If the
<graphspec>element is nested inside a<widget>element, then thisheightattribute is ignored, and the dimensions of the<widget>are applied.Valid values range from 1-4096.
The default is 400.
dpi- Specifies the resolution of bitmap images in units of dots per inch.
If the format attribute to
<graphspec>specifies a vector file format, thedpiattribute is ignored.Valid values range from 1-1200.
The default is 150.
Note: A highdpinumber can result in longer processing times and bigger file sizes. A value below 72 is not recommended. layout- Specifies the spatial arrangement of multiple
<chart>elements contained within a single<graphspec>element.Valid values for thelayoutattribute are:Layout Description rowAligns the charts/graphs horizontally. colAligns the charts/graphs vertically. fusionOverlays multiple charts on top of each other. Only specific chart combinations are allowed (e.g., scatter and line). The default is
fusion. theme- Specifies the color theme of the chart/graph in the
<graphspec>.For a list of valid values, see Color themes.
Note: Specific style attributes can be overwritten for a specific theme via the<style>tag.
Example: Bar Chart
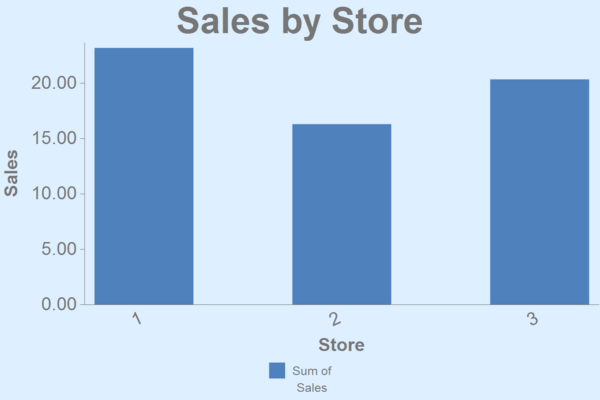
This example creates a simple bar chart showing sales totals for three stores.
<dynamic>
  <widget class_="graphics" base_="pub.demo.retail.item"
   width_="600" height_="400">
    <tabu label="Tabulation on Sales Item Detail" breaks="store">
      <tcol source="sales" fun="sum" label="Sum of`Sales"/>
    </tabu>
    <graphspec width="600" height="400">
      <chart type="bar" title="Sales by Store" samples="25">
        <data x="store" y="t0"/>
        <legend hide="0"/>
        <axes xlabel="Store" ylabel="Sales"/>
        <ticks xrot="25"/>
        <style titlesize="36" bg="lightblue"/>
      </chart>
    </graphspec>
  </widget>
</dynamic>

Example: Box & Whisker Chart
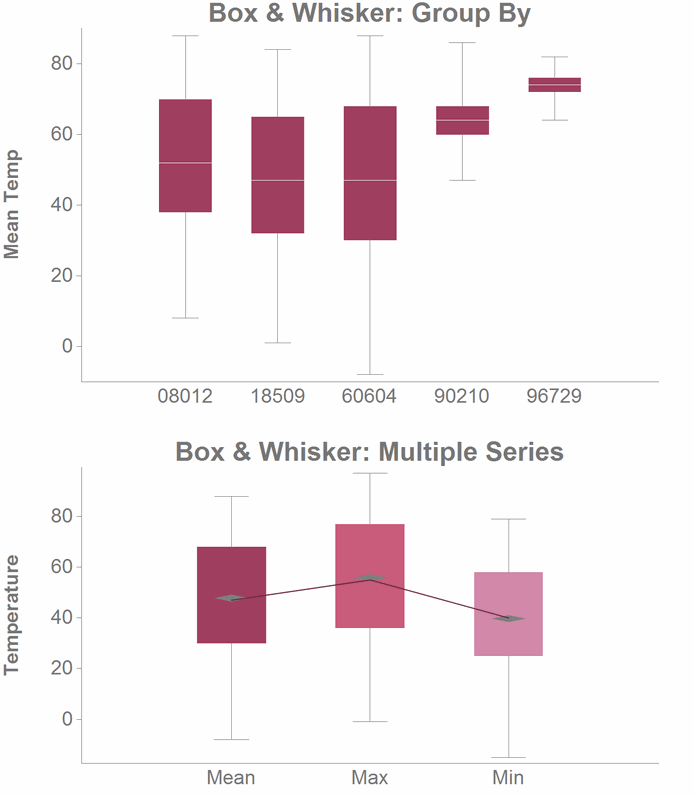
This example shows two versions of a Box & Whisker plot. The first uses the
groupby attribute to show multiple groups in the same series. The
following plot shows multiple data series for a single zip code. Both use data found in:
pub.demo.weather.wunderground.observed_daily.
<dynamic>
  <layout>
    <widget class_="graphics"
     base_="pub.demo.weather.wunderground.observed_daily">
      <sel value="zipcode=60604|zipcode=96729|zipcode=18509|zipcode=08012|zipcode=90210"/>
      <graphspec theme="candycolors" width="1000" height="600">
        <chart type="boxwhisker" title="Box & Whisker: Group By">
          <data y="meantempi" groupby="zipcode" label="Mean Temperature"/>
          <axes ylabel="Mean Temp"/>
        </chart>
      </graphspec>
    </widget>
    <widget class_="graphics"
     base_="pub.demo.weather.wunderground.observed_daily">
      <sel value="zipcode=60604"/>
      <graphspec theme="candycolors" width="1000" height="600">
        <chart type="boxwhisker" bw="diamond"
         title="Box & Whisker: Multiple Series" joinmedians="1">
          <data y="meantempi"/>
          <data y="maxtempi"/>
          <data y="mintempi"/>
          <axes ylabel="Temperature"/>
        </chart>
      </graphspec>
    </widget>
  </layout>
</dynamic>

