<layer name="polygon">
<layer name="polygon"> is used for overlaying polygons
(state/counties) on top of Google Map data.
Syntax
<dyanmic>
  <widget class_="gmap">
    <layer name="polygon">
      [1010data Query]
    </layer>
  </widget>
</dynamic>
Attributes
desc_- Accepts a column name containing text values that serve as the description of the polygon.
lat_- Accepts a column name containing valid latitudinal values.
lng_- Accepts a column name containing valid longitudinal values.
groupby_- Accepts a column.
borderopacity_- Accepts floating point values between 0 and 1. The default value is .8.
opacity_- Accepts a decimal value between
0.0and1.0(inclusive). The higher the value specified the more opaque the polygon layer. showlegend_- Accepts a
"1"to show a legend of the polygons. The default value is"0".
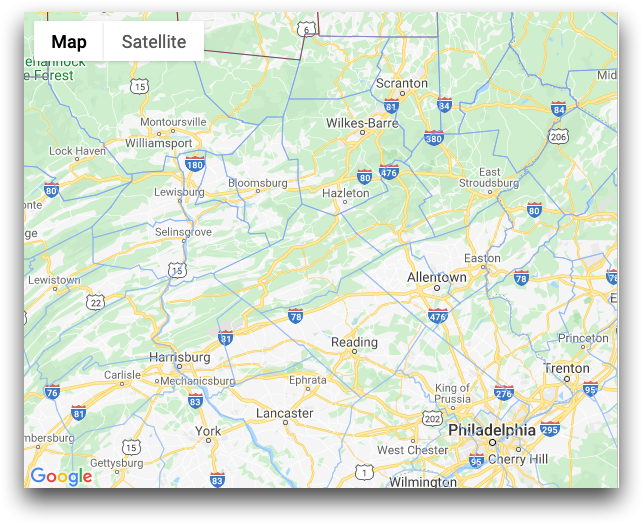
polygon layer Example
The following is a simple
example of the polygon layer. Note that this layer shows the county
boundaries on Google
maps.
<dynamic pzpack="{pkg('lat' 'lng' 'zoom' 'nelat' 'nelng' 'swlat' 'swlng';
 40.753622 -73.972841 8 '' '' '' '')}">
  <widget class_="gmap" pzvalue_="@pzpack" width_="1383" height_="495"
   theme_="thermometercolors">
    <layer name="polygon" lat_="lat" lng_="long" desc_="state" key_="id"
     groupby_="identify" weight_="weight" opacity_="0">
      <base table="pub.geo.polygons.county"/>
      <willbe name="identify" value="splice(state county_id;' ')"/>
      <willbe name="weight" value="i_()"/>
    </layer>
  </widget>
</dynamic>