<style>
The <style> element provides the ability to adapt the style of the
theme. A single <style> element can live outside of
<chart> or within. If outside, the <style> tag applies
to all <chart> tags. If within, the settings overwrite any settings of a
parent <style> tag.
Syntax
<dynamic>
  <widget class_="graphics">
    [1010data_QUERY]
      <graphspec>
        <chart>
          <data x="" y=""/>
          <legend/>
          <axes/>
          <ticks/>
          <style/>
        </chart>
    </graphspec>
  </widget>
</dynamic>
The <style> tag can also live outside the <chart>
specification:
<dynamic>
  <widget class_="graphics">
    [1010data_QUERY]
      <graphspec>
        <chart>
          <data x="" y=""/>
          <legend/>
          <axes/>
          <ticks/>
        </chart>
      <style/>
    </graphspec>
  </widget>
</dynamic>
The [1010data_QUERY] may be specified between the
opening and closing tags of the <widget>. The results of the query
provide data for the <widget> to display.
Attributes
bg- Specifies the background color of the chart.
titleshow- Specifies whether to show or hide a title.
The default is
1(show). titlecolor- Specifies the foreground color of the title.
The color can be specified as any valid HTML color name, an RGB value, or a hex value.
The default is
rgb(68,68,68). titlesize- Specifies the font size of the title.
The default is
12. titlefontfamily- Specifies the font family of the title.
titlefontweight- Specifies the weight or thickness of the font used for the title.
Valid values are:
plainbold
titlefontslant- Specifies the type of emphasis to be applied to the font used for the title.
Valid values are:
plainitalic
titlebg- Specifies the background color of the title.
The color can be specified as any valid HTML color name, an RGB value, or a hex value.
The default is
rgb(0,0,0). legendlabelcolor- Specifies the foreground color of the text in the legend.
The color can be specified as any valid HTML color name, an RGB value, or a hex value.
The default is
rgb(119,119,119). legendlabelsize- Specifies the font size of the text in the legend.
The default is
12. legendlabelfontfamily- Specifies the font family of the text in the legend.
The default is
helvetica. axescolors- Specifies the color of the axes.
The color can be specified as any valid HTML color name, an RGB value, or a hex value.
The default is
rgb(68,68,68). seriescolors- Specifies the color of the individual chart series. Depends on the chosen theme.
The color can be specified as any valid HTML color name, an RGB value, or a hex value.
The default is
rgb(139,187,107); rgb(99,156,208); rgb(240,169,100);
                rgb(195,119,94); rgb(203,139,180); rgb(149,113,170); rgb(226,107,103);
                rgb(114,114,114)
. seriesthicknesses- Specifies the thickness of the series shape.
The default is
0.007. seriesstrokes- Specifies the stroke of the series shape.
The default is
solid. seriesopacities- Specifies the opacity of the series shape.
The default is
1. seriespointsizes- Specifies the size of series points.
The default is
medium. seriesmarkertypes- Specifies the type of series markers.
The default is
circle, square,
                diamond, up, down, right, left, ring, emptysquare, emptydiamond, emptyup,
                emptydown
. seriesmarkersizes- Specifies the size of series markers.
The default is
large. seriesmarkercolors- Specifies the color of series markers.
The color can be specified as any valid HTML color name, an RGB value, or a hex value.
The default is
rgb(139,187,107); rgb(99,156,208); rgb(240,169,100);
                rgb(195,119,94); rgb(203,139,180); rgb(149,113,170); rgb(226,107,103);
                rgb(114,114,114)
. seriesmarkershow- Specifies whether to show or hide the series markers.
The default is
0(hide). scattermarkertypes- Specifies the type of scatter markers.
The default is
circle, square,
                diamond, up, down, right, left, ring, emptysquare, emptydiamond, emptyup,
                emptydown
. mesh- Specifies how wireframe lines should be drawn on a three-dimensional chart.
Valid values are:
none- No mesh drawn
all- Mesh divisions between all elements
full- Mesh divisions between regular data points
- n
- n equally spaced mesh divisions
The default is
all.
X-axis attributes
xaxisshow- Specifies whether to show or hide the x-axis.
The default is
1(show). xaxiscolor- Specifies the color of the x-axis.
The color can be specified as any valid HTML color name, an RGB value, or a hex value.
The default is
rgb(68,68,68). xaxissize- Specifies the font size of the values on the x-axis scale.
The default is
12. xaxisfontfamily- Specifies the font family of the values on the x-axis scale.
xaxisfontweight- Specifies the weight or thickness of the font used for the values on the x-axis
scale.
Valid values are:
plainbold
xaxisfontslant- Specifies the type of emphasis to be applied to the font used for the values on the
x-axis scale.
Valid values are:
plainitalic
xaxislabelshow- Specifies whether to show or hide the x-axis label.
The default is
1(show). xaxislabelcolor- Specifies the color of the x-axis label.
The color can be specified as any valid HTML color name, an RGB value, or a hex value.
The default is
rgb(68,68,68). xaxislabelsize- Specifies the font size of the x-axis label.
The default is
12. xaxislabelfontfamily- Specifies the font family of the x-axis label.
xaxislabelfontweight- Specifies the weight or thickness of the font used for the x-axis label.
Valid values are:
plainbold
xaxislabelfontslant- Specifies the type of emphasis to be applied to the font used for the x-axis
label.
Valid values are:
plainitalic
xaxislabelbg- Specifies the background color of the x-axis label.
The color can be specified as any valid HTML color name, an RGB value, or a hex value.
The default is
rgb(255,255,255).
Y-axis attributes
yaxisshow- Specifies whether to show or hide the y-axis.
The default is
1(show). yaxiscolor- Specifies the color of the y-axis.
The color can be specified as any valid HTML color name, an RGB value, or a hex value.
The default is
rgb(68,68,68). yaxissize- Specifies the font size of the values on the y-axis scale.
The default is
12. yaxisfontfamily- Specifies the font family of the values on the y-axis scale.
yaxisfontweight- Specifies the weight or thickness of the font used for the values on the y-axis
scale.
Valid values are:
plainbold
yaxisfontslant- Specifies the type of emphasis to be applied to the font used for the values on the
y-axis scale.
Valid values are:
plainitalic
yaxislabelshow- Specifies whether to show or hide the y-axis label.
The default is
1(show). yaxislabelcolor- Specifies the color of the y-axis label.
The color can be specified as any valid HTML color name, an RGB value, or a hex value.
The default is
rgb(68,68,68). yaxislabelsize- Specifies the font size of the y-axis label.
The default is
12. yaxislabelfontfamily- Specifies the font family of the y-axis label.
yaxislabelfontweight- Specifies the weight or thickness of the font used for the y-axis label.
Valid values are:
plainbold
yaxislabelfontslant- Specifies the type of emphasis to be applied to the font used for the y-axis
label.
Valid values are:
plainitalic
yaxislabelbg- Specifies the background color of the y-axis label.
The color can be specified as any valid HTML color name, an RGB value, or a hex value.
The default is
rgb(255,255,255).
Z-axis attributes
zaxisshow- Specifies whether to show or hide the z-axis.
The default is
1(show). zaxiscolor- Specifies the color of the z-axis.
The color can be specified as any valid HTML color name, an RGB value, or a hex value.
The default is
rgb(68,68,68). zaxissize- Specifies the font size of the values on the z-axis scale.
The default is
12. zaxisfontfamily- Specifies the font family of the values on the z-axis scale.
zaxisfontweight- Specifies the weight or thickness of the font used for the values on the z-axis
scale.
Valid values are:
plainbold
zaxisfontslant- Specifies the type of emphasis to be applied to the font used for the values on the
z-axis scale.
Valid values are:
plainitalic
zaxislabelshow- Specifies whether to show or hide the z-axis label.
The default is
1(show). zaxislabelcolor- Specifies the color of the z-axis label.
The color can be specified as any valid HTML color name, an RGB value, or a hex value.
The default is
rgb(68,68,68). zaxislabelsize- Specifies the font size of the z-axis label.
The default is
12. zaxislabelfontfamily- Specifies the font family of the z-axis label.
zaxislabelfontweight- Specifies the weight or thickness of the font used for the z-axis label.
Valid values are:
plainbold
zaxislabelfontslant- Specifies the type of emphasis to be applied to the font used for the z-axis
label.
Valid values are:
plainitalic
zaxislabelbg- Specifies the background color of the z-axis label.
The color can be specified as any valid HTML color name, an RGB value, or a hex value.
The default is
rgb(255,255,255).
Example: Bar chart
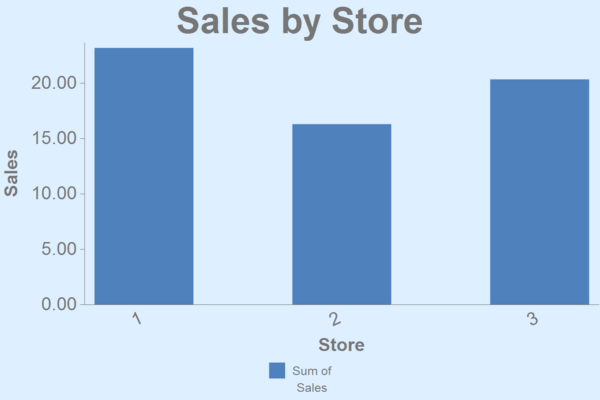
This example creates a simple bar chart showing sales totals for three stores.
<dynamic>
  <widget class_="graphics" base_="pub.demo.retail.item"
   width_="600" height_="400">
    <tabu label="Tabulation on Sales Item Detail" breaks="store">
      <tcol source="sales" fun="sum" label="Sum of`Sales"/>
    </tabu>
    <graphspec width="600" height="400">
      <chart type="bar" title="Sales by Store" samples="25">
        <data x="store" y="t0"/>
        <legend hide="0"/>
        <axes xlabel="Store" ylabel="Sales"/>
        <ticks xrot="25"/>
        <style titlesize="36" bg="lightblue"/>
      </chart>
    </graphspec>
  </widget>
</dynamic>

Example: Surface chart
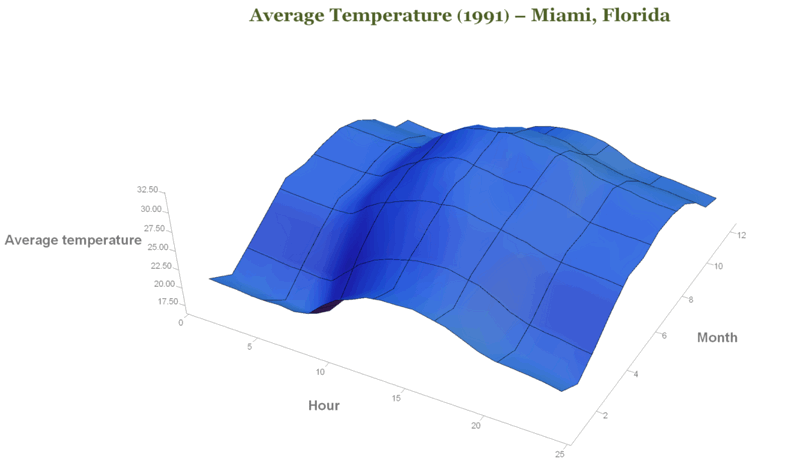
This example creates a surface chart showing the average temperature by hour and month in Miami, Florida in 1991.
<dynamic>
  <widget class_="graphics" base_="pub.demo.weather.hourly91"
   width_="1000" height_="607">
    <link table2="pub.demo.weather.stations" col="id" col2="id"
     label="stations"/>
    <sel value="id=12839"/>
    <willbe name="month" value="month(date)"/>
    <willbe name="tempx" value="if(between(temp;-40;40);temp;NA)"/>
    <tabu breaks="hour" cbreaks="month" xtab="0"
     label="Temperature by hour and month">
      <tcol source="tempx" fun="avg" name="avgtemp"/>
    </tabu>
    <graphspec width="1000" height="607">
      <chart type="surface"
       title="Average Temperature (1991) - Miami, Florida" samples="10000">
        <legend hide="1"/>
        <axes ylabel="Month" zlabel="Average temperature"/>
      </chart>
      <style titlecolor="#4f6128" titlesize="24" titlefontfamily="georgia"
       titlefontweight="bold" xaxissize="11" xaxisfontfamily="helvetica"
       xaxislabelsize="18" xaxislabelfontfamily="helvetica"
       xaxislabelfontweight="bold" yaxissize="11"
       yaxisfontfamily="helvetica" yaxislabelsize="18"
       yaxislabelfontfamily="helvetica" yaxislabelfontweight="bold"
       zaxissize="11" zaxisfontfamily="helvetica" zaxislabelsize="18"
       zaxislabelfontfamily="helvetica" zaxislabelfontweight="bold"/>
    </graphspec>
  </widget>
</dynamic>

Example: Bar chart with series
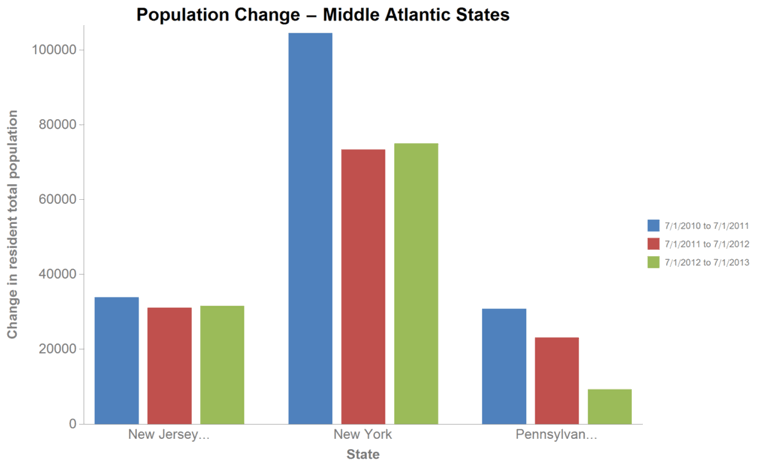
This example creates a simple bar chart showing the population for three states over three years.
<dynamic>
  <widget class_="graphics" width_="1000" height_="613">
    <table cols="name,npopchg_2011,npopchg_2012,npopchg_2013"
     labels="State,7/1/2010 to 7/1/2011,7/1/2011 to 7/1/2012,7/1/2012 to 7/1/2013">
     New Jersey,33932,31110,31590;
     New York,104500,73397,75002;
     Pennsylvania,30838,23165,9326
    </table>
    <graphspec width="1000" height="613">
      <chart type="bar" title="Population Change - Middle Atlantic States"
       samples="25" dir="bottom">
        <data x="name" y="npopchg_2011"/>
        <data x="name" y="npopchg_2012"/>
        <data x="name" y="npopchg_2013"/>
        <legend pos="right"/>
        <axes xlabel="State" ylabel="Change in resident total population"/>
        <ticks xrot="0"/>
      </chart>
      <style titlecolor="#000000" titlesize="24" titlefontfamily="helvetica"
       titlefontweight="bold" xaxissize="18" xaxisfontfamily="helvetica"
       xaxislabelsize="18" xaxislabelfontfamily="helvetica"
       xaxislabelfontweight="bold" yaxissize="18" yaxisfontfamily="helvetica"
       yaxislabelcolor="#7f7f7f" yaxislabelsize="18"
       yaxislabelfontfamily="helvetica" yaxislabelfontweight="bold"
       zaxissize="18" zaxisfontfamily="helvetica" zaxislabelsize="18"
       zaxislabelfontfamily="helvetica" zaxislabelfontweight="bold"/>
    </graphspec>
  </widget>
</dynamic>

