<geograph>
The <geograph> element is used to specify one or more layers of
polygons that represent geographic regions such as U.S. states, counties, and ZIP code areas
along with data associated with these polygons. The <geograph> element is a
child of <graphspec>, which is specified within <widget
class_="graphics">.
Description
The <geograph> element specifies one or more
<geolayer> elements, which define the types of polygons to be drawn
and labels or markers associated with those polygons. The <geograph> can
also contain elements related to the geograph as a whole, such as
<title>, <legend>, <axes>, and
colormap.
The <geolayer> elements are drawn in the order in which they appear
within the <geograph>, resulting in a layering of the polygons, labels,
and markers specified within each <geolayer> element.
Syntax
<dynamic>
<widget
      class_="graphics">
[1010data_QUERY]
<layer name="[LAYER1_NAME]">
[1010data_QUERY_1]
</layer>
<layer name="[LAYER2_NAME]">
[1010data_QUERY_2]
</layer>
...
<graphspec>
<geograph title="[TITLE]"
projection="orthographic|equirectangular|mercator"
colormap="[COLORMAP]" groupname="metrocode|dmacode|[LAYER_NAME]">
<geolayer type="[TYPE]" layername="[LAYER1_NAME]" ...>
...
</geolayer>
<geolayer type="[TYPE]" layername="[LAYER2_NAME]" ...>
...
</geolayer>
...
<title ... />
<legend ... />
<axes ... />
<colormap ... />
</geograph>
</graphspec>
</widget>
</dynamic>
An individual <geolayer> can reference the data in a particular
<layer> element by setting its layername attribute to
the name associated with the desired <layer> element. If a
<geolayer> does not specify a layername attribute,
the data from the [1010data_QUERY] specified within the
<widget> is used.
Attributes
title- Specifies a text title for the plot.
The text style is specified by the theme value or by the
<style>element as described for other<graphspec>/<charts>.Alternatively, a
<title>element can be specified as a child of<geograph>. For more information, see<title> projection- Specifies the type of geographic projection.
Valid values are:
orthographic- Displays the geographic regions using an orthographic projection, which is intended to convey the three-dimensionality of the map.
equirectangular- Displays the geographic regions using an equirectangular projection, which flattens the map along latitude and longitude lines.
mercator- Displays the geographic regions using a Mercator projection, which is a cylindrical map projection.
The default is
orthographic. colormap- Specifies a theme, gradient name, or list of colors that are used as the palette for
coloring the polygons.
Valid values are:
theme- The coloring palette is based on the theme specified in the
<graphspec>.See
<graphspec>for more information about specifying a theme.This is the default if
colormapis not specified. [THEME_NAME]- The color palette is based on a given theme name.
The first three colors in the series colors for the theme are used.
See Color themes for a list of valid values.
[LIST_OF_COLORS]- The color palette is based on a semicolon-separated list of CSS colors (e.g.,
red;yellow;green), hexadecimal values (e.g.,#F00;#FFA500;#00F), rgb values (e.g.,rgb(255,0,0);rgb(255,165,0);rgb(0,0,255), or any combination of these (e.g.,rgb(255,0,0);orange;#0000FF)
The default is the series colors for the given theme.
A
<colormap>element may be included as a child of<geograph>to specify additional attributes. For more information, see<colormap>This is also used in the legend defined by the
<legend>child element of<geograph>. groupname- Specifies how the sets of polygons will be grouped
When
type="zipcode", the following are valid values:metrocode- Grouping is performed based on the first three digits of the ZIP code.
dmacode- Grouping is performed based on the Designated Market Area (DMA), which groups counties covered by a specific group of television stations, as defined by Nielsen Media Research. There are 210 DMAs in the United States, and each DMA is represented by a 3-digit numeric code.
New groups can be defined by setting
groupnameto the name of a layer.
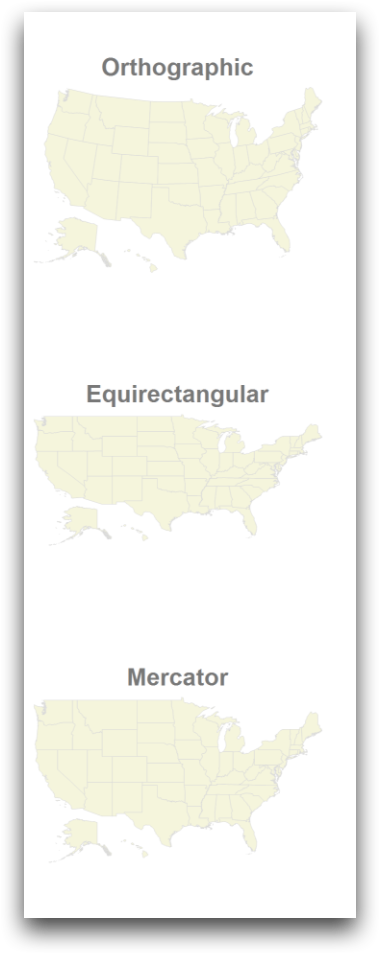
Example: Specifying a projection
The following example shows the three types of projection supported by
<geograph>. The projection is specified using the
projection attribute. If this attribute is not specified, the default is
orthographic.
<dynamic>
  <layout arrange_="v">
    <widget class_="graphics" width_="300" height_="300">
      <graphspec>
        <geograph type="states" title="Orthographic"/>
      </graphspec>
    </widget>
    <widget class_="graphics" width_="300" height_="300">
      <graphspec>
        <geograph type="states" title="Equirectangular"
         projection="equirectangular"/>
      </graphspec>
    </widget>
    <widget class_="graphics" width_="300" height_="300">
      <graphspec>
        <geograph type="states" title="Mercator"
         projection="mercator"/>
      </graphspec>
    </widget>
  </layout>
</dynamic>