<colormap>
The <colormap> element is used to specify attributes related to the
theme, gradient, or list of colors used as the palette for coloring the polygons, labels, or
markers in a geograph.
Description
The <colormap> element can be a child element of
<geograph>, <geolayer>,
<datalabel>, or <shape> and specifies attributes
related to the theme, gradient name, or list of colors as specified by its
value attribute or by the colormap attribute of its
parent element.
When <colormap> is included as a child of
<geograph>, the colormap is applied to all elements displayed by the
graphics widget. Individual <datalabel> or
<shape> elements can specify their own colormaps using their own
colormap attribute and customize settings using their own
<colormap> child element.
Syntax
<dynamic>
  <widget class_="graphics">
    [1010data_QUERY]
      <graphspec>
        <geograph colormap="[COLORMAP_VALUE]" ... >
          <geolayer ...>
            <datalabel colormap="[COLORMAP_VALUE]"...>
              <colormap value="[COLORMAP_VALUE]"
               min="[MIN]" max="[MAX]"
               reverse="0|1|true|false" opacity="[OPACITY]"/>
            <shape colormap="[COLORMAP_VALUE]"...>
              <colormap value="[COLORMAP_VALUE]"
               min="[MIN]" max="[MAX]"
               reverse="0|1|true|false" opacity="[OPACITY]"/>
            </datalabel>
          </geolabel>
          <colormap min="[MIN]" max="[MAX]"
           reverse="0|1|true|false" opacity="[OPACITY]"/>
        </geograph>
    </graphspec>
  </widget>
</dynamic>
Attributes
value- Specifies a theme or list of colors that are used as the palette for coloring the polygons.Note: This can also be specified using the
colormapattribute of the parent element (i.e.,<graphspec>,<datalabel>, and<shape>).The value specified to this attribute is also used by the legend defined by the
<legend>element.Valid values are:
theme- The coloring palette is based on the theme specified in the
<graphspec>.See
<graphspec>for more information about specifying a theme.This is the default if
valueis not specified. [THEME_NAME]- The color palette is based on a given theme name.
The first three colors in the series colors for the theme are used.
See Color themes for a list of valid values.
[LIST_OF_COLORS]- The color palette is based on a semicolon-separated list of CSS colors (e.g.,
red;yellow;green), hexadecimal values (e.g.,#F00;#FFA500;#00F), rgb values (e.g.,rgb(255,0,0);rgb(255,165,0);rgb(0,0,255), or any combination of these (e.g.,rgb(255,0,0);orange;#0000FF)
The default is
theme. colorsteps- Specifies how the list of colors or theme that is specified to the
colormapattribute are interpreted.Valid values are:
auto- Generates a continuous color interpolation.
indexed- Generates a color function that is indexed by the length of the colors
list.
Takes the integer value of the data value and uses that integer value as the index into the table of colors.
Predefined theme colors take only three colors.
[INTEGER_VALUE]- Generates an equally spaced number of interpolated colors based on the integer value specified.
[LIST_OF_VALUES]- Generates intervals for each of the colors in the colormap based on the list of values specified between the minimum and maximum values.
min- Specifies the minimum value to which the colormap is applied.
By default, the minimum value is determined by the data values to which the colormap is being applied.
max- Specifies the maximum value to which the colormap is applied.
By default, the maximum value is determined by the data values to which the colormap is being applied.
defcolor- Specifies the default color to use for non-numeric values.
By default, the color at the minimum value is used.
opacity- Specifies the opacity of the colormap. Accepts values between 0 and 1.
wrap- Specifies whether or not to cycle through the colormap for data values that fall
outside the minimum and maximum values. Accepts
1or0(ortrueorfalse).When
wrap="0"(or is not specified), data values outside the range are mapped to colors corresponding to the minimum or maximum.When
wrap="1", the colors will wrap around cyclically.The default is
0. scalereverse- Specifies whether or not to reverse the colors in the colormap. Accepts
1or0.
Example
The following example displays three graphics widgets that each produce a
geograph of three states. The first <geograph> specifies
colormap="theme", which uses the theme specified in the parent
<graphspec>, which in this example is rainbow. The
second <geograph> specifies the name of the color theme to use, which in
this case is temperaturemap. The third <geograph> sets
colormap="red,white,blue", so that a gradient consisting of these three
colors will be used for the colormap.
<dynamic>
  <layout arrange_="v">
    <widget class_="graphics" width_="300" height_="300">
      <table cols="state, val1, val2">
        Pennsylvania,100,10;
        NY,0,6;
        New Jersey,45,-15;
      </table>
      <graphspec theme="rainbow">
        <geograph type="geolayers" title="Default Theme"
         colormap="theme">
          <geolayer type="states" x="state" y="val1"/>
          <legend hide="no"/>
        </geograph>
      </graphspec>
    </widget>
    <widget class_="graphics" width_="300" height_="300">
      <table cols="state, val1, val2">
        Pennsylvania,100,10;
        NY,0,6;
        New Jersey,45,-15;
      </table>
      <graphspec>
        <geograph type="geolayers" title="Temperature"
         colormap="temperaturemap">
          <geolayer type="states" x="state" y="val1"/>
          <legend hide="no"/>
        </geograph>
      </graphspec>
    </widget>
    <widget class_="graphics" width_="300" height_="300">
      <table cols="state, val1, val2">
        Pennsylvania,100,10;
        NY,0,6;
        New Jersey,45,-15;
      </table>
      <graphspec>
        <geograph type="geolayers" title="Custom list of colors"
         colormap="red,white,blue">
          <geolayer type="states" x="state" y="val1"/>
          <legend hide="no"/>
        </geograph>
      </graphspec>
    </widget>
  </layout>
</dynamic>

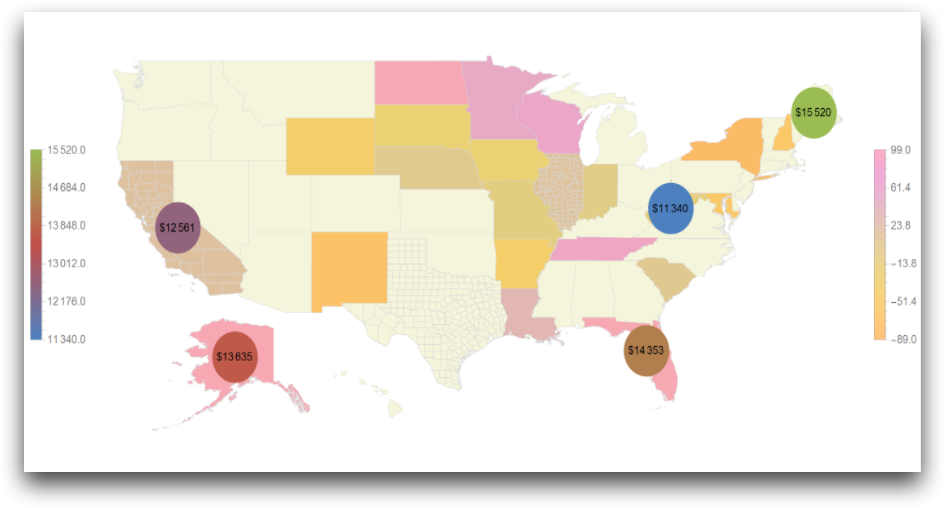
Example: Multiple colormaps
<dynamic>
  <widget class_="graphics" width_="900" height_="700">
    <base table="pub.doc.samples.geograph.states"/>
    <layer name="layer1">
      <table cols="state, val1, val2">
        Arkansas, -47, -3;
        California, 22, -5;
        Florida, 99, 60;
        Indiana, -1, -50;
        Iowa, -22, -76;
        Louisiana, 40, 42;
        Maryland, -61, -9;
        Minnesota, 64, -29;
        Missouri, -5, 30;
        Nebraska, 6, 52;
        NewHampshire, -64, 29;
        NewMexico, -77, 20;
        NY, -89, 6;
        NorthDakota, 97, 17;
        SouthCarolina, 9, 51;
        SouthDakota, -24, 38;
        Tennessee, 79, -65;
        WestVirginia, -18, 34;
        Wisconsin, 70, 62;
        Wyoming, -45, 49;
        il, 20, 15;
        ak, 99, -99
      </table>
    </layer>
    <graphspec>
      <geograph projection="equirectangular">
        <geolayer type="states"/>
        <geolayer type="states" layername="layer1" x="state" y="val1" colormap="fruitpunchcolors">
          <colormap opacity="0.5"/>
          <shape type="polygon"/>
        </geolayer>
        <geolayer type="counties" states="CA,TX,Illinois">
          <shape opacity="0"/>
        </geolayer>
        <geolayer type="states" states="ca,fl,wv,me,ak" x="names" datalabel="value" y="retailsalespercapita">
          <datalabel color="black" size="12" format="type:currency;dec:0"/>
          <shape type="point" pointsize="0.06">
            <colormap value="brightbands"/>
          </shape>
          <legend hide="no" pos="left"/>
        </geolayer>
        <legend hide="no"/>
      </geograph>
      <frame/>
    </graphspec>
  </widget>
</dynamic>