<legend>
The <legend> element specifies whether or not a legend should be
displayed by the graphics widget for its associated colormap as well as its
position in relation to the geograph.
Description
The legend displays the range of colors in the associated colormap as a gradient. The
colormap may be defined by the colormap attribute of the parent element or
by a sibling <colormap> element. See <colormap> for more information.
By default, the legend is hidden, but it can be displayed by setting the
hide attribute to 0. It can be positioned above, below,
to the left, or to the right of the geograph using the pos attribute.
Syntax
<dynamic>
  <widget class_="graphics">
    [1010data_QUERY]
      <graphspec>
        <geograph>
          <geolayer ...>
            <legend hide="0|1"
                    pos="right|left|top|bottom"/>
          </geolayer>
        </geograph>
    </graphspec>
  </widget>
</dynamic>
Attributes
hide- Specifies whether or not to hide the legend. Accepts
1or0.The default is
1. pos- Specifies the position of the legend. Accepts
right,left,top, orbottom.The default is
right.
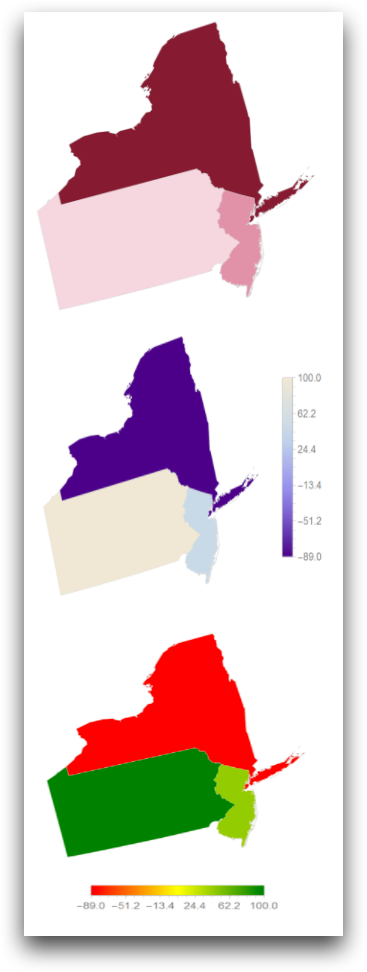
Example
The following example displays three graphics widgets that each produce a
geograph of three states. The first <geograph> explicitly specifies
<legend hide="yes"/>, so that no legend is displayed. The second
<geograph> specifies <legend hide="yes"/>, so the
legend is displayed in its default position, which is to the right of the geograph. The
third <geograph> sets <legend hide="0"
pos="bottom"/>, so that the legend is displayed below the geograph.
<dynamic>
  <layout arrange_="v">
    <widget class_="graphics" width_="300" height_="300">
      <table cols="state, val1, val2">
        Pennsylvania,100,10;
        NY,-89,6;
        New Jersey,45,-15;
      </table>
      <graphspec theme="valentinetones">
        <geograph type="geolayers" colormap="theme">
          <geolayer type="states" x="state" y="val1"/>
          <legend hide="yes"/>
        </geograph>
      </graphspec>
    </widget>
    <widget class_="graphics" width_="300" height_="300">
      <table cols="state, val1, val2">
        Pennsylvania,100,10;
        NY,-89,6;
        New Jersey,45,-15;
      </table>
      <graphspec>
        <geograph type="geolayers" colormap="lakecolors">
          <geolayer type="states" x="state" y="val1"/>
          <legend hide="no"/>
        </geograph>
      </graphspec>
    </widget>
    <widget class_="graphics" width_="300" height_="300">
      <table cols="state, val1, val2">
        Pennsylvania,100,10;
        NY,-89,6;
        New Jersey,45,-15;
      </table>
      <graphspec>
        <geograph type="geolayers" colormap="red,yellow,green">
          <geolayer type="states" x="state" y="val1"/>
          <legend hide="0" pos="bottom"/>
        </geograph>
      </graphspec>
    </widget>
  </layout>
</dynamic>
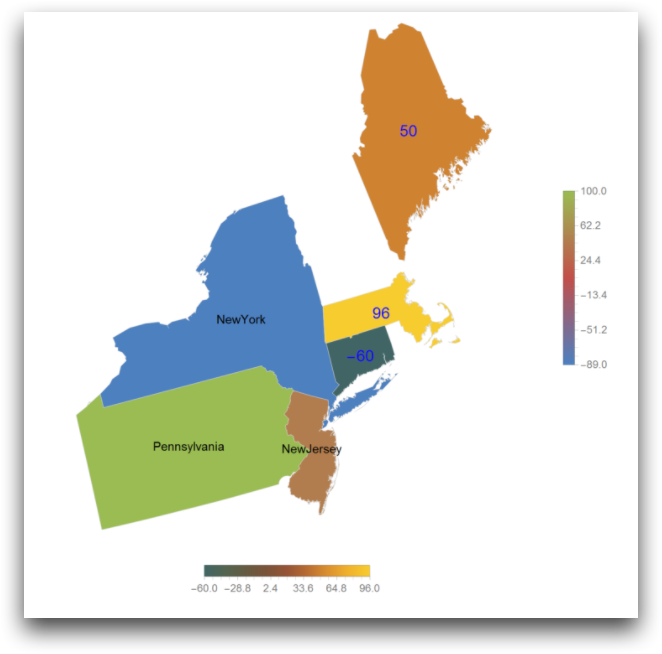
Example: Multiple legends
The following example demonstrates how multiple legends can be specified for multiple
colormaps. The first <geolayer> element, which produces the polygons for
the states Pennsylvania, New York, and New Jersey, uses the default colormap, since no
colormap attribute is explicitly specified. The legend associated with
this colormap appears to the right of the geograph in the default position, since the
pos attribute is not specified to the <legend>
element. The second <geolayer>, which draws the states Connecticut,
Massachusettes, and Maine, specifies the fallcolors color theme for the
colormap via the value attribute to its child
<colormap> element. The legend associated with this colormap appears
below the geograph, as specified via the pos attribute to the
<legend> element.
<dynamic>
  <widget class_="graphics" width_="600" height_="600">
    <table cols="state, val1, val2">
      Pennsylvania,100,10;
      NY,-89,6;
      New Jersey,45,-15;
      Connecticut,-45,-60;
      MA,12,96;
      ME,100,50;
    </table>
    <graphspec>
      <geograph type="geolayers">
        <geolayer type="states" states="Pennsylvania,NY,New Jersey"
         x="state" y="val1" datalabel="fullname">
          <datalabel color="black" size="14"/>
          <legend hide="0"/>
        </geolayer>
        <geolayer type="states" states="CT,Massachusetts,Maine"
         x="state" y="val2" datalabel="value">
          <colormap value="fallcolors"/>
          <datalabel color="rgb(25,25,255)" size="18"/>
          <legend hide="0" pos="bottom"/>
        </geolayer>
      </geograph>
    </graphspec>
  </widget>
</dynamic>