<geolayer>
A <geolayer> element defines the type of polygons that will be
drawn on that layer and the data set on which it is based.
Syntax
<dynamic>
  <widget class_="graphics">
    [1010data_QUERY]
    <layer name="[LAYER_NAME_1]">
      [1010data_QUERY_1]
    </layer>
    <layer name="[LAYER_NAME_2]">
      [1010data_QUERY_2]
    </layer>
    ...
    <graphspec>
      <geograph type="geolayers" ...>
        <geolayer layername="[LAYER_NAME]" ...>
         type="states|counties|zipcodes|countries|locations"
         states="all|continental|[LIST_OF_STATES]"
         countries="all|europe|africa|asia|
                    southamerica|northamerica|oceania|
                    [LIST_OF_COUNTRIES]"
         datalabel="none|auto|value|name|fullname"
         x="" y="" value=""
         name="" namevalue=""
         shape="" size=""

          ...
        </geolayer>
        <geolayer layername="[LAYER_NAME]" ...>
          ...
        </geolayer>
          ...
      </geograph>
    </graphspec>
  </widget>
</dynamic>
Attributes
type- Specifies the type of polygon region.
Valid values are:
states- U.S. state polygons. The states to include in the geograph are specified using
the
statesattribute. counties- U.S. county polygons. The states to include in the geograph are specified using
the
statesattribute. zipcodes- U.S. ZIP code polygons. The states to include in the geograph are specified
using the
statesattribute.The first time this plot is generated, it will take longer than expected since all the ZIP code polygons (~35K) need to be loaded into the system. Subsequent runs will be faster.
Note that all the ZIP code polygons do not completely cover the all U.S. region (e.g., lakes, mountains, etc.)
countries- Polygons representing countries. The countries to include in the geograph are
specified using the
countriesattribute.Note: You must setprojection="mercator"whentype="countries". locations- A point defined by latitude and longitude coordinates on which a shape can be
drawn.
When
type="locations", thexattribute specifies a column name containing the longitude values, and theyattribute specifies a column name containing the latitude values.For more information on defining shapes, see
shape.
states- Determines which states are included in the layer. Valid state name or FIPS codes are
expected.
This is used when
typeis set tostates,counties, orzipcodes.Valid values are:
all- All states, including Alaska and Hawaii, are included.
continental- Only states within the continental United States are included.
[LIST_OF_STATES]- Only the states specified in a a comma-separated list are included. States may
be specified using the full name, two-letter abbreviation, or FIPS code.
Multi-word state names may be written with spaces between the words, or the spaces may be omitted. The values in this list are not case sensitive. Examples of valid entries:
Illinois,texas,CA,fl,18.For a complete list of state names, abbreviations, and FIPS codes, see State names, abbreviations, and FIPS codes.
The default is
all. countries- Determines which countries are included in the layer. Valid country names or FIPS
codes are expected.
This is used when
typeis set tocountries.Valid values are:
all- All countries are included.
europe- Only the countries of Europe are included.
africa- Only the countries in Africa are included.
asia- Only the countries in Asia are included.
southamerica- Only the countries in South America are included.
northamerica- Only the countries in North America are included.
oceania- Only the countries in Oceania are included.
[LIST_OF_COUNTRIES]- Only the countries specified in a a comma-separated list are included. Countries
may be specified using the full name or FIPS code.
Multi-word country names may be written with spaces between the words, or the spaces may be omitted. The values in this list are not case sensitive.
For a complete list of country names and their FIPS codes, see Country names and FIPS codes.
The default is
all. x- Specifies the column name containing the names of the polygons associated with the
typeattribute.When
type="locations", this attribute specifies a column name containing the longitude values. y- Specifies the column name for the values to be plotted in association with the
polygons defined by the
xattribute.When
type="locations", this attribute specifies a column name containing the latitude values. datalabel- Specifies what type of data values are used for the labels of the polygons or points
associated with the
<geolayer>.Valid values are:
none- No labels are displayed.
auto- The short name associated with the polygon is used for the labels. For more
information, see
namebelow. value- The value from the column specified by the
yattribute is used as the label. name- The short name associated with the polygon is used for the labels, depending on
the type.
For instance, if the
typeattribute for the<geolayer>is set tostates, the polygons will be labeled with the two-letter abbreviation of the state. If thetypeattribute for this<geolayer>is set tocounties, the polygons will be labeled with the name of the county.You can override this by specifying the name of a column that contains the name you want to use for the particular polygon to the
nameattribute. fullname- The full name associated with the polygon is used for the labels, depending on
the type.
For instance, if the
typeattribute for the<geolayer>is set tostates, the polygons will be labeled with the full state name. If thetypeattribute for this<geolayer>is set tocounties, the polygons will be labeled with the name of the county along with the two-letter abbreviation of the state it is in.
name- When
datalabel="name", this attribute specifies the name of the column from the data set to use for the label of the polygon. value- When
datalabel="value", this attribute specifies the name of the column from the data set to use for the label of the polygon. namevalue- Specifies the name of a column that contains numeric values to map in association with the colormap for the label of the polygon.
shape- When
type="locations", this references the name of a column in the data set that specifies the marker shape to draw at a particular set of coordinates. The longitude coordinate is specified in the column referenced by thexattribute, and the latitude coordinate is specified in the column referenced by theyattribute. size- When
type="locations", this specifies the name of a column in the data set that specifies the size of the shape to use. layername- Specifies the name of a
<layer>element that provides a 1010data query which provides the data. If this attribute is not specified, the<geolayer>element uses the 1010data query specified within the<widget class_="graphics">element.
Example: type="states"
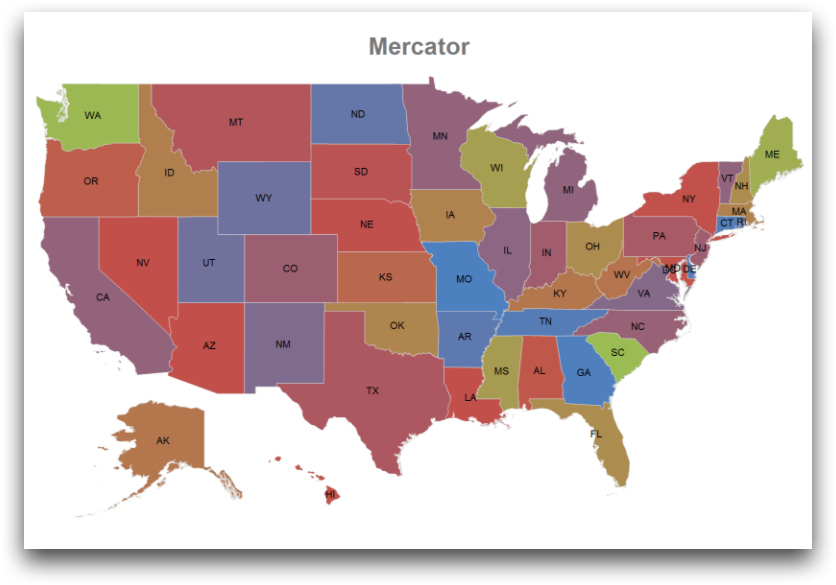
<dynamic>
  <widget class_="graphics" width_="800" height_="800">
    <graphspec>
      <geograph title="Mercator" projection="mercator">
        <geolayer type="states" states="all"
         demosamples="52" datalabel="name">
          <datalabel color="black" size="10"/>
          <shape type="polygon"/>
        </geolayer>
      </geograph>
    </graphspec>
  </widget>
</dynamic>
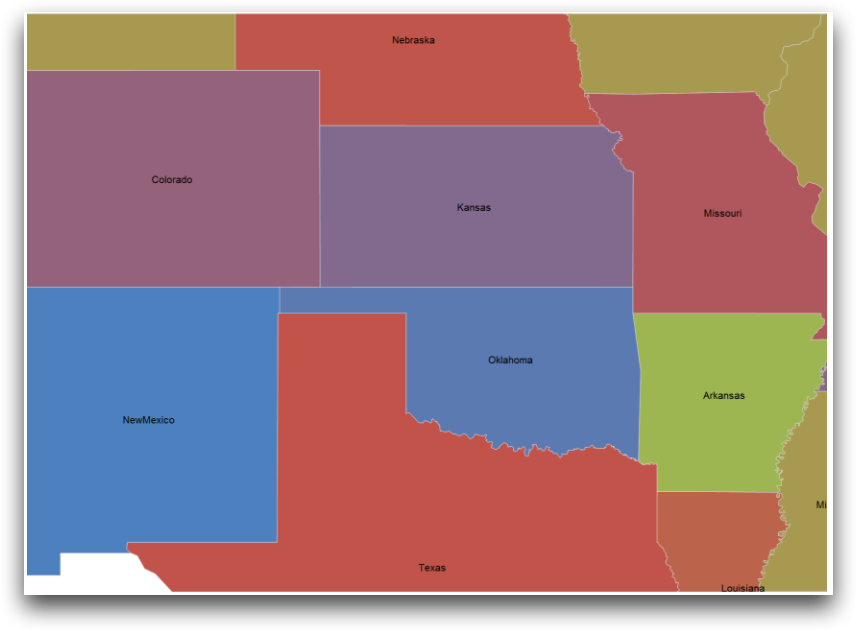
Example: type="states" with <axes> element
<dynamic>
  <widget class_="graphics" width_="800" height_="800">
    <graphspec>
      <geograph title="Mercator" projection="mercator">
        <geolayer type="states" states="all"
         demosamples="52" datalabel="fullname">
          <datalabel color="black" size="10"/>
          <shape type="polygon"/>
          <axes xmin="-109" ymin="31" xmax="-90" ymax="42"/>
        </geolayer>
      </geograph>
    </graphspec>
  </widget>
</dynamic>
Example: type="countries"
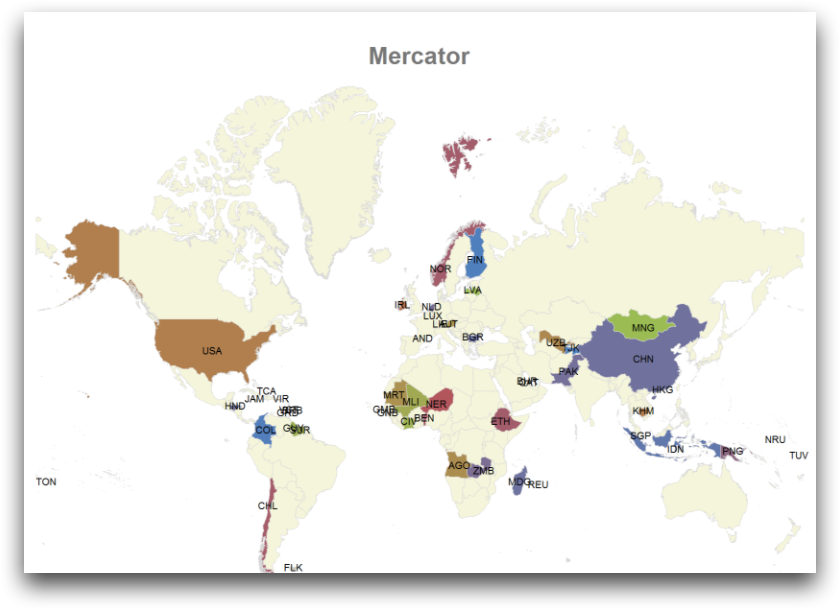
<dynamic>
  <widget class_="graphics" width_="800" height_="800">
    <graphspec>
      <geograph title="Mercator" projection="mercator">
        <geolayer type="countries" demosamples="50" datalabel="name">
          <datalabel color="black" size="10"/>
          <shape type="polygon"/>
        </geolayer>
      </geograph>
    </graphspec>
  </widget>
</dynamic>
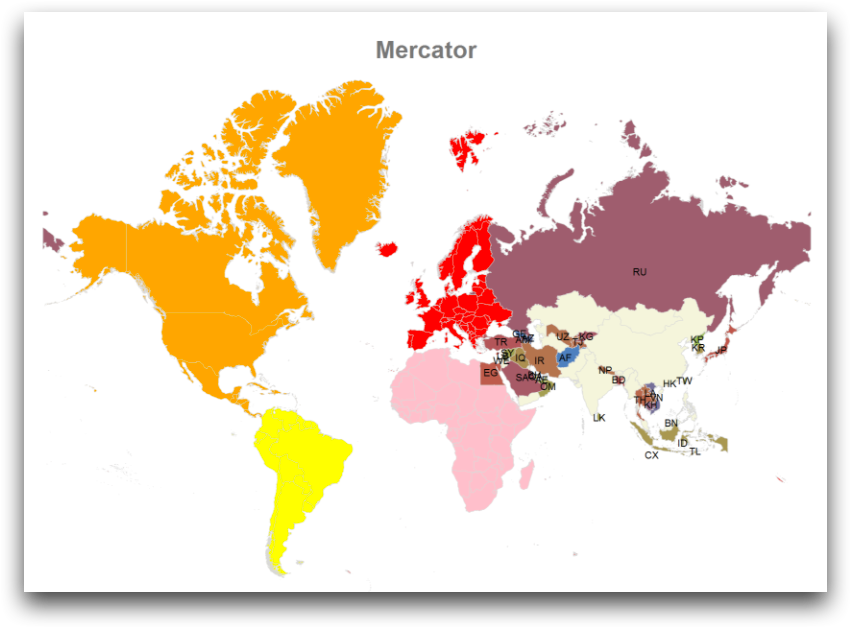
Example: type="countries" multiple layers
<dynamic>
  <widget class_="graphics" width_="800" height_="800">
    <graphspec>
      <geograph title="Mercator"
       projection="mercator">
        <geolayer type="countries" countries="Europe">
          <shape color="red"/>
        </geolayer>
        <geolayer type="countries" countries="Asia">
          <shape color="green"/>
        </geolayer>
        <geolayer type="countries" countries="africa">
          <shape color="pink"/>
        </geolayer>
        <geolayer type="countries" countries="South America">
          <shape color="yellow"/>
        </geolayer>
        <geolayer type="countries" countries="northamerica">
          <shape color="orange"/>
        </geolayer>
        <geolayer type="countries" countries="Asia"
         demosamples="150" datalabel="fips">
          <datalabel color="black" size="10"/>
          <shape type="polygon"/>
        </geolayer>
      </geograph>
    </graphspec>
  </widget>
</dynamic>
Example: Multiple geolayers
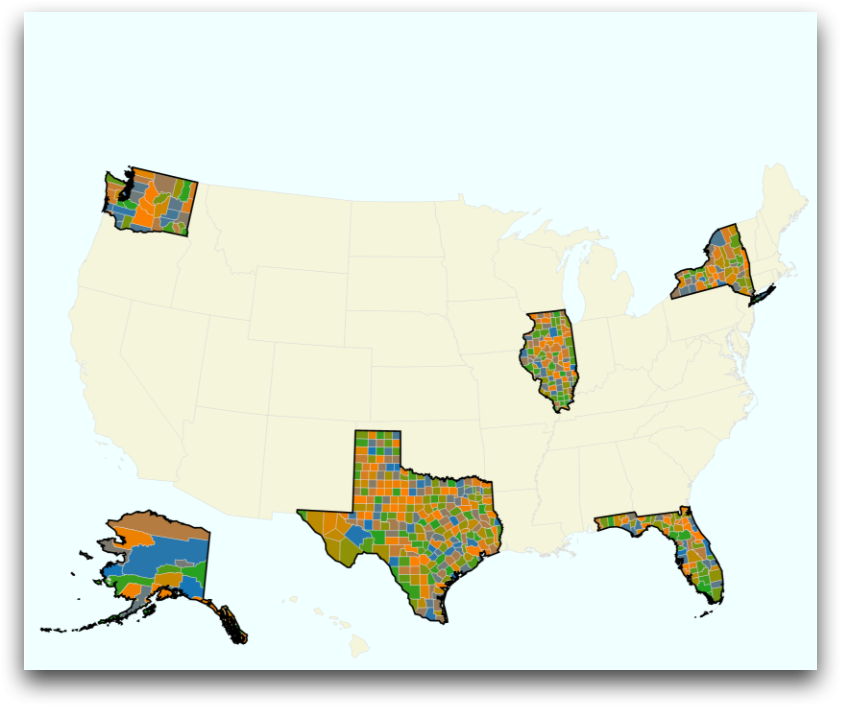
<dynamic>
  <widget class_="graphics" width_="800" height_="800">
    <graphspec theme="happy">
      <geograph background="azure">
        <geolayer type="states" states="all">
          <shape type="polygon" color="auto"
           edgecolor="auto" thickness="thin"/>
        </geolayer>
        <geolayer type="counties" demosamples="10000"
         states="texas,il,ny,fl,ak,53">
          <shape type="polygon"/>
        </geolayer>
        <geolayer type="states" states="fl,tx,ny,il,ak,53">
          <shape edgecolor="black" thickness="0.002" opacity="0"/>
        </geolayer>
      </geograph>
    </graphspec>
  </widget>
</dynamic>