<data>
The <data> element provides the ability to select data sources for
a chart to define series data, labels, or other chart elements.
A single <data> element is used to define a single series of data in a
chart. For charts with multiple series, multiple <data> elements can be
used, one element for each series in the chart. <data> elements must be
contained by a <chart> element.
Syntax
<dynamic>
  <widget class_="graphics">
    [1010data_QUERY]
      <graphspec>
        <chart>
          <data x="" y=""/>
          <legend/>
          <axes/>
          <ticks/>
          <style/>
        </chart>
    </graphspec>
  </widget>
</dynamic>
The [1010data_QUERY] may be specified between the
opening and closing tags of the <widget>. The results of the query
provide data for the <widget> to display.
Attributes
x- The
xattribute specifies the data that is typically used as the x-axis of the chart.For pie charts,
xis used to specify the labels that will appear that are not sections of the pie chart. For bar charts the attribute is used to produce that labels that are rendered next to each bar. Valid values are column names of columns containing numeric or text values. Exact uses ofxare chart-type-dependent. If no value or an unknown value is provided, then a syntheticrow countcolumn is used or an appropriate error message is displayed. y- The
yattribute specifies the data that is typically used as the y-axis of the chart.Valid values are column names of columns containing numeric or text values. Exact uses of
yare chart-type-dependent. If no value or an unknown value is provided, then a syntheticrow countcolumn is used or an appropriate error message is displayed. yaxis- When multiple data tags are specified when using multiple y-axes,
yaxisspecifies which of the two y-axes should be handle by the chart as the "secondary" y-axis. To specify that which y-axis series should be considered "secondary" in a<data>element, use:yaxis="s".If
yaxis="s", theasattribute can be used to specify that the second y-axis should be rendered as bars, not a line, usingas="bar". z- The
zattribute specifies a data source of the chart and usually corresponds to data that is plotted on the z-axis.zcan also be used to specify other chart-specific characteristics. For bubble charts, the attribute is used to specify the size of each bubble (i.e., the size of a bubble corresponds to the specific value in a column of valid values forz). For surface charts, the attribute is used to specify the height of a surface.Valid values are column names containing text or numerical data. If no or an unknown value is specified for
z, then an appropriate error message is displayed. yo- The
yoattribute specifies a data source of a Candlestick chart, and usually corresponds to a price column.Valid values are column names of columns containing numeric data most commonly corresponding to "open" prices.
If no or an unknown value is specified for
yothen an appropriate error message is displayed. yh- The
yhattribute specifies a data source of a Candlestick chart, and usually corresponds to a price column.Valid values are column names of columns containing numeric data most commonly corresponding to "high" prices.
If no or an unknown value is specified for
yhthen an appropriate error message is displayed. yl- The
ylattribute specifies a data source of a Candlestick chart, and usually corresponds to a price column.Valid values are column names of columns containing numeric data most commonly corresponding to "low" prices.
If no or an unknown value is specified for
yothen an appropriate error message is displayed. yc- The
ycattribute specifies a data source of a Candlestick chart, and usually corresponds to a price column.Valid values are column names of columns containing numeric data most commonly corresponding to "close" prices.
If no or an unknown value is specified for
ycthen an appropriate error message is displayed. label- The
labelattribute specifies a data series label. Such labels appear in legend entries.Valid values are strings.
If no value or an unknown value for
labelis provided, then column names are used as the default. groupby- The
groupbyattribute allows for specifying a column to aggregate data before the data is plotted.Chart types that supportgroupbyare as follows:boxwhiskerlinescatterline2dscatter2d
Example: Bar Chart
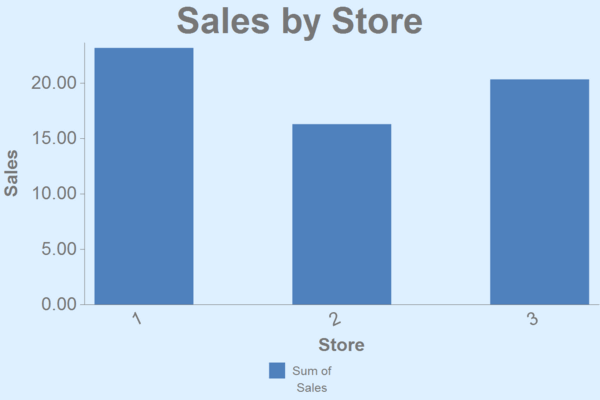
This example creates a simple bar chart showing sales totals for three stores.
<dynamic>
  <widget class_="graphics" base_="pub.demo.retail.item"
   width_="600" height_="400">
    <tabu label="Tabulation on Sales Item Detail" breaks="store">
      <tcol source="sales" fun="sum" label="Sum of`Sales"/>
    </tabu>
    <graphspec width="600" height="400">
      <chart type="bar" title="Sales by Store" samples="25">
        <data x="store" y="t0"/>
        <legend hide="0"/>
        <axes xlabel="Store" ylabel="Sales"/>
        <ticks xrot="25"/>
        <style titlesize="36" bg="lightblue"/>
      </chart>
    </graphspec>
  </widget>
</dynamic>

