<grid>
The <grid> element specifies whether to include graphing lines
behind the graphic. A single <grid> element must be contained within a
<chart> element.
Syntax
<dynamic>
  <widget class_="graphics">
    [1010data_QUERY]
      <graphspec>
        <chart>
          <data x="" y=""/>
          <legend/>
          <grid/>
          <axes/>
          <ticks/>
          <style/>
        </chart>
    </graphspec>
  </widget>
</dynamic>
The [1010data_QUERY] may be specified between the
opening and closing tags of the <widget>. The results of the query
provide data for the <widget> to display.
Attributes
Note: The
<grid> element works with the following charts:- Line
- Bar
- Histogram 1d
- Scatter
- Bridge
- Boxwhisker
hide- Specifies whether to show or hide the grid lines behind a chart.
Valid values are
0to show and1to hide.If no value is specified, the default is to hide the the grid.
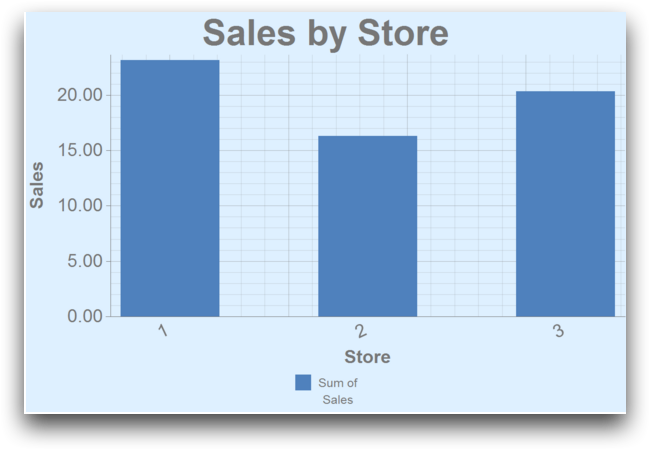
Example: Bar Chart
This example creates a simple bar chart showing sales totals for three stores with grid lines behind the bar chart.
<dynamic>
  <widget class_="graphics" base_="pub.demo.retail.item" width_="600" height_="400">
    <tabu label="Tabulation on Sales Item Detail" breaks="store">
      <tcol source="sales" fun="sum" label="Sum of`Sales"/>
    </tabu>
    <graphspec width="600" height="400">
      <chart type="bar" title="Sales by Store" samples="25">
        <data x="store" y="t0"/>
        <legend hide="0"/>
        <axes xlabel="Store" ylabel="Sales"/>
        <grid hide="0"/>
        <ticks xrot="25"/>
        <style titlesize="36" bg="lightblue"/>
      </chart>
    </graphspec>
  </widget>
</dynamic>