<legend>
The <legend> element provides the ability to customize the
appearance of the legend in a chart. A single <legend> element must be
contained within a <chart> element.
Syntax
<dynamic>
  <widget class_="graphics">
    [1010data_QUERY]
      <graphspec>
        <chart>
          <data x="" y=""/>
          <legend/>
          <axes/>
          <ticks/>
          <style/>
        </chart>
    </graphspec>
  </widget>
</dynamic>
The [1010data_QUERY] may be specified between the
opening and closing tags of the <widget>. The results of the query
provide data for the <widget> to display.
Attributes
hide- Specifies whether to show or hide the legend of a chart.
Valid values are
0to show and1to hide.If no value is specified, the default is to show the legend.
pos- Specifies the position where the legend should appear in the chart.
Valid values are:
toprightleft
or a comma-separated pair of numbers between
0and1(i.e.,.5,.7where the first number of the pair controls the horizontal relative position of the legend and the second number controls the vertical relative position of the legend.
Example: Bar Chart
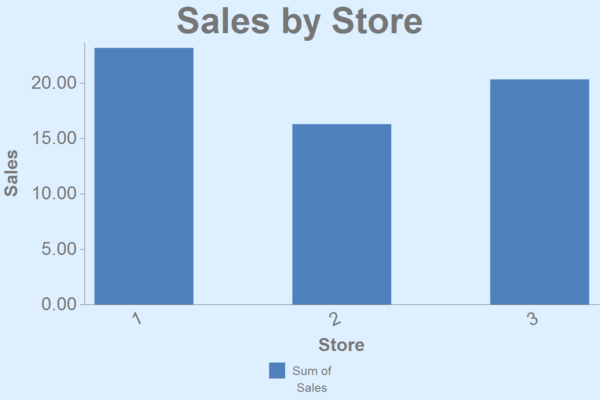
This example creates a simple bar chart showing sales totals for three stores.
<dynamic>
  <widget class_="graphics" base_="pub.demo.retail.item"
   width_="600" height_="400">
    <tabu label="Tabulation on Sales Item Detail" breaks="store">
      <tcol source="sales" fun="sum" label="Sum of`Sales"/>
    </tabu>
    <graphspec width="600" height="400">
      <chart type="bar" title="Sales by Store" samples="25">
        <data x="store" y="t0"/>
        <legend hide="0"/>
        <axes xlabel="Store" ylabel="Sales"/>
        <ticks xrot="25"/>
        <style titlesize="36" bg="lightblue"/>
      </chart>
    </graphspec>
  </widget>
</dynamic>

