
<layer>
The <layer> element is contained within a <widget
class_="chart">. Using <layer>, you can specify the data to be
plotted via a 1010data query. (Available as of version 10.16)
Description
One or more <layer> elements, each containing a 1010data query, may
appear inside the chart widget. Each <layer> may bear
one or more value*_ (and associated
row*_/col*_) attributes, and/or a
tablevalue_ attribute, using exactly the same syntax as familiar from
<do> clauses. (See <do> for more
information).
Variables set thus by <layer> queries have scope only in subsequent
clauses (<layer> and <graphspec>) within the widget
itself; in other words, they do not change the global <dynamic>
environment and need not be specified in the <dynamic> clause.
Syntax
<dynamic>
    <widget class_="chart" engine_="ENGINE_TYPE"
      type_="CHART_TYPE">
      <layer tablevalue_="TABLE_VAR">
        [1010data_QUERY]
      </layer>
    </widget>
</dynamic>
Attributes
tablevalue_- Accepts the name of a variable to which the
<layer>can assign the result of the [1010data_QUERY] as a table value.The table-value variable specified to thetablevalue_attribute can be indexed using the following syntax:@foo.barprovides a list consisting of the values in the columnbar@foo.17provides a dictionary consisting of the row 17@foo._colsprovides a list of column names@foo._rowsprovides the number of rows
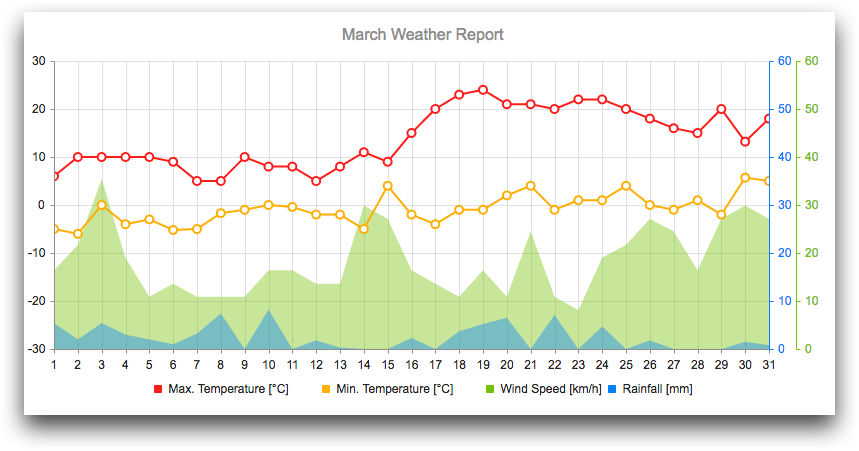
Example
This example uses a <layer> element, which contains a
<table> op that specifies the data and stores it in a variable named
data (as specified using the tabledata_ attribute), the
plot documented at https://demos.telerik.com/kendo-ui/line-charts/multiple-axes may be represented as
follows.
<dynamic> <widget class_="chart" width_="800" height_="400"> <layer tablevalue_="data"> <table cols="day,maxtemp,mintemp,windspeed,rainfall"> 1,6.0,-5.0,16.4,5.4; 2,10.0,-6.0,21.7,2.0; 3,10.0,0.0,35.4,5.4; 4,10.0,-4.0,19.0,3.0; 5,10.0,-3.0,10.9,2.0; 6,9.0,-5.2,13.6,1.0; 7,5.0,-5.0,10.9,3.2; 8,5.0,-1.7,10.9,7.4; 9,10.0,-1.0,10.9,0.0; 10,8.0,0.0,16.4,8.2; 11,8.0,-0.4,16.4,0.0; 12,5.0,-2.0,13.6,1.8; 13,8.0,-2.0,13.6,0.3; 14,11.0,-5.0,29.9,0.0; 15,9.0,4.0,27.1,0.0; 16,15.0,-2.0,16.4,2.3; 17,20.0,-4.0,13.6,0.0; 18,23.0,-1.0,10.9,3.7; 19,24.0,-1.0,16.4,5.2; 20,21.0,2.0,10.9,6.5; 21,21.0,4.0,24.5,0.0; 22,20.0,-1.0,10.9,7.1; 23,22.0,1.0,8.1,0.0; 24,22.0,1.0,19.0,4.7; 25,20.0,4.0,21.7,0.0; 26,18.0,0.0,27.1,1.8; 27,16.0,-1.0,24.5,0.0; 28,15.0,1.0,16.4,0.0; 29,20.0,-2.0,27.1,0.0; 30,13.2,5.7,29.9,1.5; 31,18.0,5.0,27.1,0.8; </table> </layer> <graphspec> <title text="March Weather Report"/> <legend position="bottom"/> <series type="line" name="Max. Temperature [°C]" color="#ff1c1c" axis="temp" data="{@data.maxtemp}"/> <series type="line" name="Min. Temperature [°C]" color="#ffae00" axis="temp" data="{@data.mintemp}"/> <series type="area" name="Wind Speed [km/h]" color="#73c100" axis="wind" data="{@data.windspeed}"/> <series type="area" name="Rainfall [mm]" color="#007eff" axis="rain" data="{@data.rainfall}"/> <valueaxes name="rain" color="#007eff" min="0" max="60"/> <valueaxes name="wind" color="#73c100" min="0" max="60"/> <valueaxes name="temp" min="-30" max="30"/> <categoryaxis categories="{@data.day}" axiscrossingvalues="{lst(32, 32, 0)}" justified="true"/> <tooltip visible="true" format="{0}%" template="#= category #/03: #= value #"/> </graphspec> </widget> </dynamic>
<table> op inside the
<layer> to provide the data for the chart widget;
however, the <layer> could, and ordinarily would, contain a query on a
real physical table.