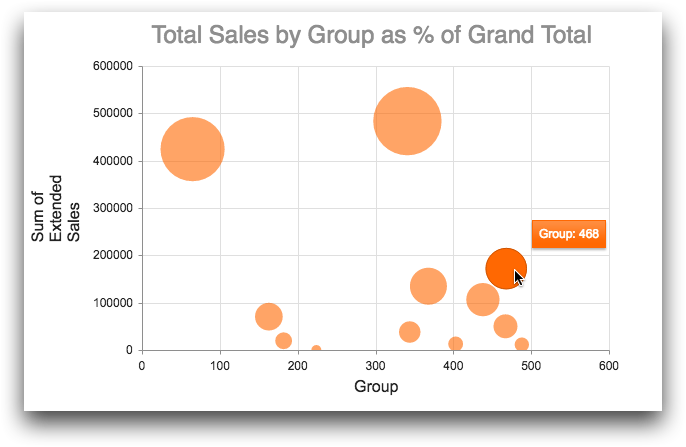
type_="bubble"
Using <widget class_="chart" type_="bubble"> produces a chart with
bubbles whose size and positions on the x-axis and y-axis represent values in the data set. (Available as of version 10.16)
Syntax
<dynamic>
    <widget class_="chart" type_="bubble">
      [1010data_QUERY]
    </widget>
</dynamic>
The [1010data_QUERY] associated with the widget should result in two or three numeric columns.
If the query results in two columns, the row number is represented on the X axis, the values in the first column are represented on the Y axis, and the size of the bubbles is determined by the second column.
If the query results in three columns, the values in the first column are represented on the X axis, the values in the second column are represented on the Y axis, and the size of the bubbles is determined by the third column.
Attributes for type_="bubble"
breaks_- Accepts the name of a column that is used to color the bubble plot according to
group.
(Prior to version 10.26, this attribute was named
groupby_.)
Example: type_="bubble"
The following example uses the table pub.doc.retail.salesdetail to
create a bubble chart that shows the total sales in January 2014 for each group. The size of
each bubble represents the total sales in the associated group as a percentage of the grand
total. The hints_ attribute specifies that the column
tooltip should be used to display the corresponding group when the user
points to a particular bubble. The <graphspec> element defines the text
and qualities of the title.
<dynamic>
  <widget class_="chart" type_="bubble"
   base_="pub.doc.retail.salesdetail"
   hints_="tooltip">
    <sel value="yrmo(trans_date)=201401"/>
    <link table2="pub.doc.retail.product" col="sku" col2="sku"/>
    <sel value="(deptdesc='PRODUCE')"/>
    <tabu label="Tabulation on Sales Detail" breaks="group">
      <tcol fun="sum" source="xsales" label="Sum of`Extended`Sales"/>
      <tcol fun="PGsum" source="xsales"
       label="Sum of`Extended`Sales` as a % of`Grand Total"/>
    </tabu>
    <willbe name="tooltip" value="splice('Group: ' group; '')"/>
    <graphspec>
      <title text="Total Sales by Group as % of Grand Total"
       font="24px sans-serif">
        <margin left="100"/>
      </title>
    </graphspec>
  </widget>
</dynamic>

