<datalabel>
Specifies the text style to be used for labeling.
Description
The <datalabel> element may contain a <colormap>
child element, which makes it possible to use different colormaps for each set of
datalabels.
Syntax
<dynamic>
  <widget class_="graphics">
    <graphspec>
      <geograph ...>
        <geolayer datalabel="">
          <datalabel color="black" size="10" format="" colormap="">
            <colormap .../>
          </datalabel>
        </geolayer>
      </geograph>
    </graphspec>
  </widget>
</dynamic>
Attributes
Same attributes as <title>.
color- Specifies the color of the label for the polygon.
The color can be specified as any valid HTML color name, an RGB value, or a hex value.
format- When the
datalabelattribute in<geolayer>is set tovalue, this attributes specifies the display format for that value.For information on display formats, see Display formats.
size- Specifies the font size of the label.
colormap- Specifies a theme, gradient name, or list of colors that are used as the palette for
coloring the datalabels.
Valid values are:
theme- The coloring palette is based on the theme specified in the
<graphspec>.See
<graphspec>for more information about specifying a theme.This is the default if
colormapis not specified. [THEME_NAME]- The color palette is based on a given theme name.
The first three colors in the series colors for the theme are used.
See Color themes for a list of valid values.
[LIST_OF_COLORS]- The color palette is based on a semicolon-separated list of CSS colors (e.g.,
red;yellow;green), hexadecimal values (e.g.,#F00;#FFA500;#00F), rgb values (e.g.,rgb(255,0,0);rgb(255,165,0);rgb(0,0,255), or any combination of these (e.g.,rgb(255,0,0);orange;#0000FF)
The default is the series colors for the given theme.
A
<colormap>element may be included as a child of<datalabel>to specify additional attributes. For more information, see<colormap>This colormap is also used by the
<legend>child element of<datalabel>.
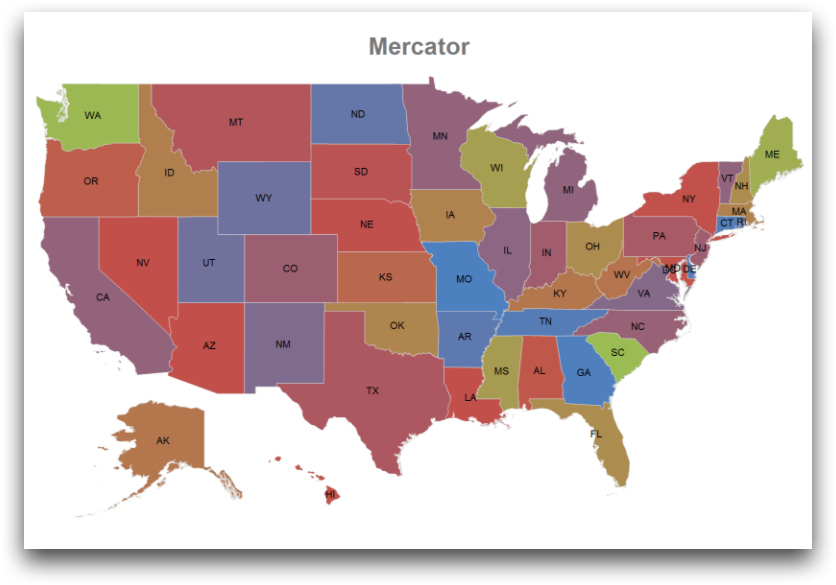
Example: type="states"
<dynamic>
  <widget class_="graphics" width_="800" height_="800">
    <graphspec>
      <geograph type="geolayers" title="Mercator"
       projection="mercator">
        <geolayer type="states" states="all"
         demosamples="52" datalabel="name">
          <datalabel color="black" size="10"/>
          <shape type="polygon"/>
        </geolayer>
      </geograph>
    </graphspec>
  </widget>
</dynamic>