<shape>
The <shape> element is a child of the
<geolayer> element and specifies attributes related to the
polygon.
Description
When the type attribute in <geolayer> is set to
states, counties, or countries, the
default shape is polygon. When type is zipcodes or
loacations, the default shape is point.
Syntax
<dynamic>
  <widget class_="graphics">
    <graphspec>
      <geograph ...>
        <geolayer shape="[SHAPE_TYPE]">
          <shape type="[SHAPE_TYPE]"
           colormap="[COLORMAP]"
           shapesize="[SHAPE_SIZE]"
           color="[SHAPE_COLOR]"
           edgecolor="[EDGE_COLOR]"
           opacity="[OPACITY]"
           thickness="[THICKNESS]|thick|thin"
           pointsize="[POINT_SIZE]|small|medium|large">
            <colormap .../>
          </datalabel>
        </geolayer>
      </geograph>
    </graphspec>
  </widget>
</dynamic>
Attributes
type- Specifies the type of shape to use.
Valid values are:
polygonpoint[SHAPE_TYPE]-
For a list of valid shapes, see Shape icons.
colormap- Specifies a theme, gradient name, or list of colors that are used as the palette for
coloring the shapes.
This is also used in the legend defined by the
<legend>element.Valid values are:
theme- The coloring palette is based on the theme specified in the
<graphspec>.See
<graphspec>for more information about specifying a theme.This is the default if
colormapis not specified. [THEME_NAME]- The color palette is based on a given theme name.
The first three colors in the series colors for the theme are used.
See Color themes for a list of valid values.
[LIST_OF_COLORS]- The color palette is based on a semicolon-separated list of CSS colors (e.g.,
red;yellow;green), hexadecimal values (e.g.,#F00;#FFA500;#00F), rgb values (e.g.,rgb(255,0,0);rgb(255,165,0);rgb(0,0,255), or any combination of these (e.g.,rgb(255,0,0);orange;#0000FF)
The default is the series colors for the given theme.
A
<colormap>element may be included as a child of<shape>to specify additional attributes. For more information, see<colormap> shapesize- Specifies the size of the shape.
color- Specifies the color used to fill the shape.
The color can be specified as any valid HTML color name, an RGB value, or a hex value.
edgecolor- Specifies the color used to outline the shape.
The color can be specified as any valid HTML color name, an RGB value, or a hex value.
opacity- Specifies the opacity of the color within the polygon. Accepts a value between 0 and
1.
To draw a completely transparent polygon (i.e., when only the outline of the polygon is needed), set
opacity="0". thickness- Specifies the polygon boundary thickness as a fraction of the plot range.
To draw polygons without a boundary, set
thickness="0".The following values can also be specified:thickthin
pointsize- Specifies the point size as a fraction of the plot range.The following values can also be specified:
smallmediumlarge
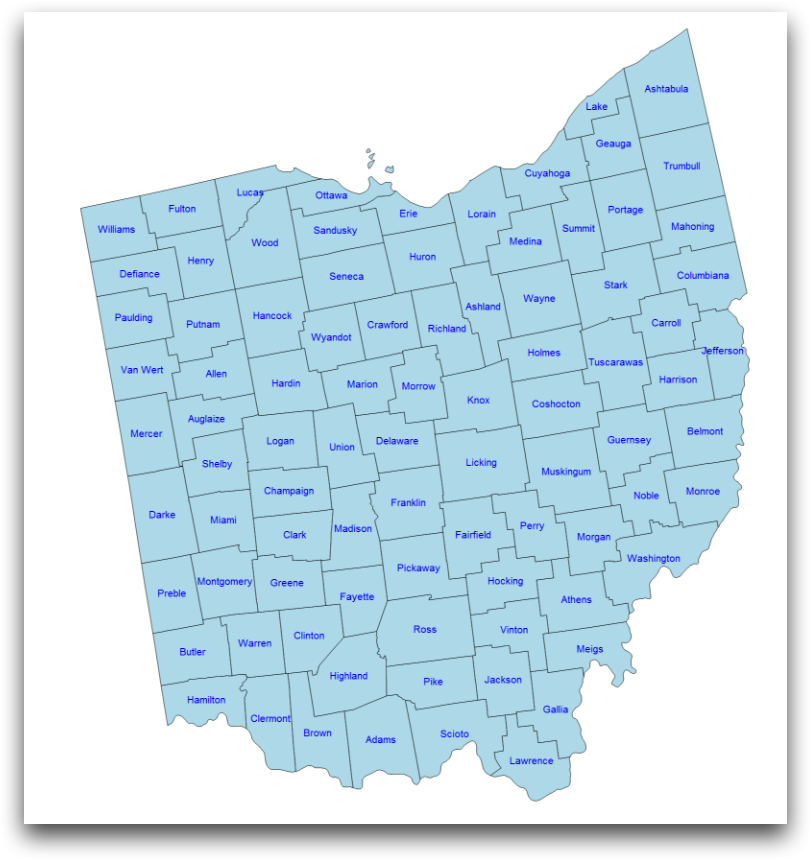
Example
<dynamic>
  <widget class_="graphics" width_="800" height_="800">
    <graphspec>
      <geograph type="counties">
        <data states="oh" datalabel="name">
          <datalabel color="blue" size="10"/>
        </data>
        <shape type="polygon" color="lightblue" edgecolor="black" thickness="thin"/>
      </geograph>
    </graphspec>
  </widget>
</dynamic>
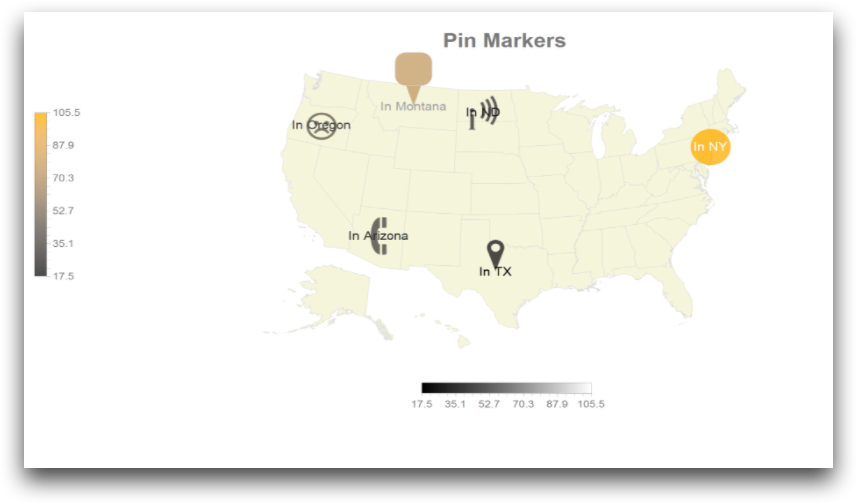
Example
<dynamic>
  <widget class_="graphics" width_="900">
    <table cols="state, lat, long, value, label, markersize, markershape">
      New York, 40.66, -73.93, 105.5, In NY, 5, point;
      Montana, 47.04, -109.65, 75.3, In Montana, 10, pushpin;
      North Dakota, 46.81, -100.77, 25.3, In ND, 15, wifi;
      Tx, 31.48, -99.37, 17.5, In TX, 40, pin;
      Arizona, 34.3287, -111.67, 33.0, In Arizona, 30, telephone;
      Oregon, 43.93, -120.56, 42, In Oregon, 80, sad
    </table>
    <graphspec>
      <geograph title="Pin Markers" projection="orthographic">
        <geolayer type="states"/>
        <geolayer type="locations" x="long" y="lat"
         value="value" datalabel="name" name="label" namevalue="value"
         shape="markershape" size="markersize">
          <datalabel color="white" size="15">
            <colormap value="black,white" xmin="10" xmax="120"/>
            <legend hide="0"/>
          </datalabel>
          <shape type="pin" edgecolor="lightgray" shapesize="40,80">
            <colormap value="black,orange" opacity="0.7"/>
            <legend hide="0"/>
          </shape>
        </geolayer>
      </geograph>
    </graphspec>
  </widget>
</dynamic>